| | |
| | |

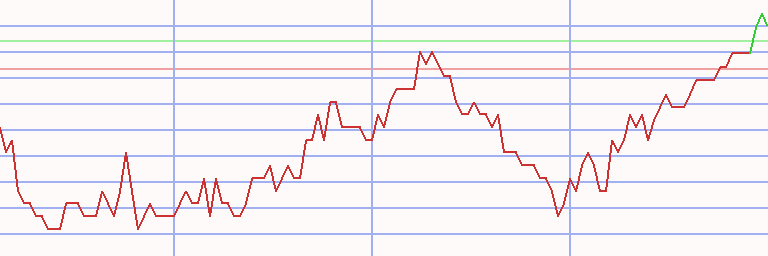
Assessment - OMX Copenhagen 20 in Euro - 1/07/24 - RS = 33
⇐
| |
|
⇓instrument |
freshest |
⇓ Δday |
1/07/24 |
⇓ Δwk |
13/11/23 |
prc diff |
⇓ Δ33 |
|
∅-RS |
| |  |
 |
 |
|
|
 |
OMXC 20 |
358.064 |
12/08/24 |
-2.06 |
388.302 |
-7.79 |
293.047 |
95.255 |
32.51 |
|
24.12 |
| | |
|
|
|
L |
|
Rockwool |
367.956 |
12/08/24 |
-0.22 |
378.683 |
-2.83 |
216.286 |
162.397 |
75.08 |
|
45.99 |
| | |
|
|
|
|
|
Novo Nordisk |
119.733 |
12/08/24 |
-2.80 |
134.711 |
-11.12 |
92.991 |
41.721 |
44.87 |
|
39.62 |
| | |
|
|
|
L |
|
Ambu |
18.465 |
12/08/24 |
-0.40 |
18.311 |
0.84 |
11.033 |
7.278 |
65.96 |
|
37.89 |
| | |
|
|
|
L |
|
GN Store Nord |
172.000 |
12/08/24 |
-0.98 |
192.300 |
-10.56 |
139.500 |
52.800 |
37.85 |
|
29.59 |
| | |
|
|
|
|
|
Pandora |
139.593 |
12/08/24 |
1.56 |
135.301 |
3.17 |
118.562 |
16.740 |
14.12 |
|
14.54 |
| | |
|
|
|
|
|
Novonesis |
57.553 |
12/08/24 |
0.12 |
56.642 |
1.61 |
46.690 |
9.952 |
21.31 |
|
20.55 |
| | |
|
|
|
|
|
Danske Bank |
26.611 |
12/08/24 |
0.15 |
28.039 |
-5.09 |
22.386 |
5.653 |
25.25 |
|
16.12 |
| | |
|
|
|
|
|
Jyske Bank |
69.595 |
12/08/24 |
0.48 |
74.020 |
-5.98 |
63.129 |
10.891 |
17.25 |
|
6.13 |
| | |
|
|
|
|
|
Demant |
34.811 |
12/08/24 |
-1.44 |
40.470 |
-13.98 |
35.493 |
4.976 |
14.02 |
|
0.12 |
| | |
|
|
|
|
|
Tryg |
19.926 |
12/08/24 |
0.61 |
20.530 |
-2.94 |
19.141 |
1.389 |
7.25 |
|
8.80 |
| | |
|
|
|
|
|
Coloplast |
118.593 |
12/08/24 |
0.25 |
111.620 |
6.25 |
94.882 |
16.739 |
17.64 |
|
2.21 |
| | |
|
|
|
|
|
ISS |
16.856 |
12/08/24 |
0.48 |
16.212 |
3.97 |
15.776 |
0.436 |
2.77 |
|
-2.29 |
| | |
|
|
|
L |
|
Møller-Mærsk B |
1,444.199 |
12/08/24 |
1.99 |
1,724.457 |
-16.25 |
1,333.383 |
391.074 |
29.33 |
|
12.65 |
| | |
|
|
|
L |
|
Møller-Mærsk A |
1,418.721 |
12/08/24 |
1.93 |
1,678.865 |
-15.50 |
1,324.131 |
354.734 |
26.79 |
|
11.69 |
| | |
|
|
|
L |
|
Carlsberg B |
107.490 |
12/08/24 |
|
113.176 |
-5.02 |
111.214 |
1.962 |
1.76 |
|
-8.85 |
| | |
|
|
|
|
|
Vestas Wind Systems |
20.416 |
12/08/24 |
-7.76 |
21.737 |
-6.08 |
22.527 |
-0.790 |
-3.51 |
|
-8.63 |
| | |
|
|
|
L |
|
Ørsted |
55.985 |
12/08/24 |
0.63 |
50.420 |
11.04 |
39.181 |
11.239 |
28.68 |
|
-5.24 |
| | |
|
|
|
L |
|
DSV |
162.992 |
12/08/24 |
|
153.337 |
6.30 |
142.939 |
10.398 |
7.27 |
|
-2.41 |
| | |
|
|
|
|
|
Genmab |
244.186 |
12/08/24 |
0.89 |
232.587 |
4.99 |
302.774 |
-70.186 |
-23.18 |
|
-20.65 |
| OMXC 20 - 19 out of 19 instruments rated - 1/07/24 / 13/11/23 - 17 did rise, Market-Ratio(33) in EUR = 89.47 % |
| Stock Exchange Currency: DKK kr Danish krone |
Technical Chart
Transactions OMX Copenhagen 20 in Euro * L33 - 84/73 (1)
|
⇐ |
| |
| L/S | date buy | date sell | days | | instrument | spl | pieces | | prc buy | prc sell | | prc diff | d % | asset | yield | |
| 2/01/06 |
10/07/06 |
189 |
|
- cash - |
| long |
10/07/06 |
30/07/07 |
385 |
|
|
|
Vestas Wind Systems |
100 |
2,246 |
|
4.451 |
9.730 |
|
5.279 |
119 |
21,858 |
110 |
|
| 30/07/07 |
6/07/09 |
707 |
|
- cash - |
| |
6/07/09 |
26/04/10 |
294 |
|
|
|
GN Store Nord |
100 |
1,061 |
|
20.600 |
43.400 |
|
22.800 |
111 |
46,048 |
152 |
|
| 26/04/10 |
2/08/10 |
98 |
|
- cash - |
| |
2/08/10 |
23/08/10 |
21 |
|
|
|
Novonesis |
100 |
2,309 |
|
19.941 |
19.019 |
|
-0.922 |
-5 |
43,920 |
-56 |
|
| 23/08/10 |
27/12/10 |
126 |
|
- cash - |
| |
27/12/10 |
28/02/11 |
63 |
|
|
|
Novo Nordisk |
100 |
5,162 |
|
8.507 |
9.113 |
|
0.606 |
7 |
47,049 |
49 |
|
| 28/02/11 |
26/03/12 |
392 |
|
- cash - |
| |
26/03/12 |
4/06/12 |
70 |
|
|
|
GN Store Nord |
100 |
778 |
|
60.400 |
67.500 |
|
7.100 |
12 |
52,573 |
79 |
|
| 4/06/12 |
9/07/12 |
35 |
|
- cash - |
| |
9/07/12 |
17/09/12 |
70 |
|
|
|
Genmab |
100 |
6,684 |
|
7.865 |
9.799 |
|
1.934 |
25 |
65,498 |
215 |
|
| 17/09/12 |
31/12/12 |
105 |
|
- cash - |
| |
31/12/12 |
17/06/13 |
168 |
|
|
|
Pandora |
100 |
3,790 |
|
17.278 |
24.938 |
|
7.660 |
44 |
94,528 |
122 |
|
| 17/06/13 |
24/06/13 |
7 |
|
- cash - |
| |
24/06/13 |
25/08/14 |
427 |
|
|
|
Vestas Wind Systems |
100 |
49,444 |
|
1.912 |
6.854 |
|
4.942 |
259 |
338,903 |
198 |
|
| 25/08/14 |
2/03/15 |
189 |
|
- cash - |
| |
2/03/15 |
24/08/15 |
175 |
|
|
|
Genmab |
100 |
5,206 |
|
65.098 |
73.412 |
|
8.314 |
13 |
382,187 |
28 |
|
| 24/08/15 |
26/09/16 |
399 |
|
- cash - |
| |
26/09/16 |
24/10/16 |
28 |
|
|
|
Genmab |
100 |
2,511 |
|
152.196 |
150.175 |
|
-2.022 |
-1 |
377,110 |
-16 |
|
| 24/10/16 |
13/02/17 |
112 |
|
- cash - |
| |
13/02/17 |
20/02/17 |
7 |
|
|
|
FLSmidth |
100 |
7,874 |
|
47.891 |
47.019 |
|
-0.872 |
-2 |
370,241 |
-62 |
|
| 20/02/17 |
1/05/17 |
70 |
|
- cash - |
| |
1/05/17 |
6/11/17 |
189 |
|
|
|
Lundbeck B |
100 |
38,690 |
|
9.569 |
9.902 |
|
0.333 |
3 |
383,111 |
7 |
|
| 6/11/17 |
26/10/20 |
1085 |
|
- cash - |
| |
26/10/20 |
11/01/21 |
77 |
|
|
|
Pandora |
100 |
5,494 |
|
69.728 |
86.130 |
|
16.402 |
24 |
473,221 |
172 |
|
| 11/01/21 |
15/02/21 |
35 |
|
- cash - |
| |
15/02/21 |
1/03/21 |
14 |
|
|
|
Pandora |
100 |
5,619 |
|
84.212 |
80.553 |
|
-3.660 |
-4 |
452,658 |
-69 |
|
| 1/03/21 |
26/04/21 |
56 |
|
- cash - |
| |
26/04/21 |
17/05/21 |
21 |
|
|
|
Ambu |
100 |
9,630 |
|
47.000 |
30.890 |
|
-16.110 |
-34 |
297,519 |
-100 |
|
| 17/05/21 |
14/06/21 |
28 |
|
- cash - |
| |
14/06/21 |
9/08/21 |
56 |
|
|
|
Møller-Mærsk B |
100 |
12,062 |
|
24.664 |
23.678 |
|
-0.986 |
-4 |
285,624 |
-23 |
|
| 9/08/21 |
10/06/24 |
1036 |
|
- cash - |
| |
10/06/24 |
12/08/24 |
63 |
|
|
|
Rockwool |
100 |
749 |
|
381.315 |
367.956 |
|
-13.359 |
-4 |
275,618 |
-19 |
|
| accum | 10/07/06 |
12/08/24 | 2844 |
days out of 7513 invested (38%) |
2,656 |
275,618 |
53 |
|
Instrument Related Contribution
| instrument | L/S | date buy | date sell | days | prc buy | prc sell | | prc diff | d % | | | total |
| Vestas Wind Systems | long | 10/07/06 | 30/07/07 | 385 | 4.45 | 9.73 | | 5.28 | 118.62 | | | |
| | | 24/06/13 | 25/08/14 | 427 | 1.91 | 6.85 | | 4.94 | 258.52 | | | 683.79 |
| GN Store Nord | | 6/07/09 | 26/04/10 | 294 | 20.60 | 43.40 | | 22.80 | 110.68 | | | |
| | | 26/03/12 | 4/06/12 | 70 | 60.40 | 67.50 | | 7.10 | 11.75 | | | 135.44 |
| Pandora | | 31/12/12 | 17/06/13 | 168 | 17.28 | 24.94 | | 7.66 | 44.33 | | | |
| | | 26/10/20 | 11/01/21 | 77 | 69.73 | 86.13 | | 16.40 | 23.52 | | | |
| | | 15/02/21 | 1/03/21 | 14 | 84.21 | 80.55 | | -3.66 | -4.35 | | | 70.53 |
| Genmab | | 9/07/12 | 17/09/12 | 70 | 7.87 | 9.80 | | 1.93 | 24.59 | | | |
| | | 2/03/15 | 24/08/15 | 175 | 65.10 | 73.41 | | 8.31 | 12.77 | | | |
| | | 26/09/16 | 24/10/16 | 28 | 152.20 | 150.17 | | -2.02 | -1.33 | | | 38.63 |
| Novo Nordisk | | 27/12/10 | 28/02/11 | 63 | 8.51 | 9.11 | | 0.61 | 7.13 | | | 7.13 |
| Lundbeck B | | 1/05/17 | 6/11/17 | 189 | 9.57 | 9.90 | | 0.33 | 3.48 | | | 3.48 |
| FLSmidth | | 13/02/17 | 20/02/17 | 7 | 47.89 | 47.02 | | -0.87 | -1.82 | | | -1.82 |
| Rockwool | | 10/06/24 | 12/08/24 | 63 | 381.32 | 367.96 | | -13.36 | -3.50 | | | -3.50 |
| Møller-Mærsk B | | 14/06/21 | 9/08/21 | 56 | 24.66 | 23.68 | | -0.99 | -4.00 | | | -4.00 |
| Novonesis | | 2/08/10 | 23/08/10 | 21 | 19.94 | 19.02 | | -0.92 | -4.62 | | | -4.62 |
| Ambu | | 26/04/21 | 17/05/21 | 21 | 47.00 | 30.89 | | -16.11 | -34.28 | | | -34.28 |
Annotations
| 13/09/23 | Novo Nordisk | | | stock split 1:2 (two for one) |
| 18/06/18 | OMXC 20 | | | Ambu, FLSmidth and Tryg replace Møller-Mærsk A, Nordea Bank and TDC |
| 14/02/18 | OMXC 20 | | | Nordea Bank replaces Nets (acquired by Evergood 5) |
| 22/03/17 | OMXC 20 | | | index adaption: Dong Energy, Lundbeck and Nets for FlSmidth, Nordea and Tryg |
| 25/05/16 | William Demant | | | forward stock split 1:5 (five for one) |
| 16/09/15 | OMXC 20 | | | complete analysis
it was really a pleasure,
this combination of instruments seems to have been built for Share-o-matic |
| 18/05/15 | Tryg | | | forward stock split 1:5 (five for one) |
|
|