| | |
| | |

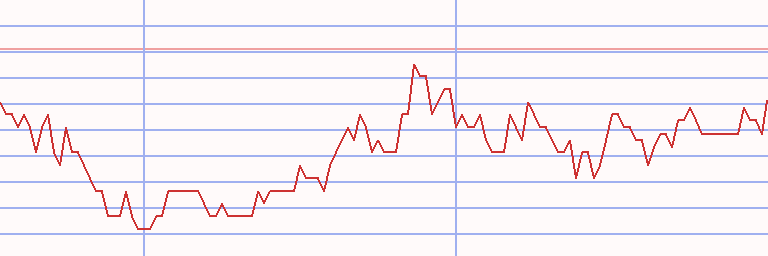
Assessment - OMX Copenhagen 20 - 7/01/24 - RS = 52
⇐
| |
|
⇓instrument |
freshest |
Δday |
7/01/24 |
⇓ Δwk |
7/03/23 |
prc diff |
⇓ Δ52 |
|
⇓∅-RS |
| |  |
 |
 |
|
|
 |
OMXC 20 |
2,670.230 |
8/12/24 |
-2.06 |
2,895.730 |
-7.79 |
2,024.730 |
871.000 |
43.02 |
|
22.89 |
| | |
|
|
|
L |
|
Møller-Mærsk B |
10,770.000 |
8/12/24 |
1.99 |
12,860.000 |
-16.25 |
12,400.000 |
460.000 |
3.71 |
|
2.38 |
| | |
|
|
|
L |
|
Møller-Mærsk A |
10,580.000 |
8/12/24 |
1.93 |
12,520.000 |
-15.50 |
12,230.000 |
290.000 |
2.37 |
|
1.55 |
| | |
|
|
|
|
|
Pandora |
1,041.000 |
8/12/24 |
1.56 |
1,009.000 |
3.17 |
611.600 |
397.400 |
64.98 |
|
20.75 |
| | |
|
|
|
|
|
Genmab |
1,821.000 |
8/12/24 |
0.89 |
1,734.500 |
4.99 |
2,593.000 |
-858.500 |
-33.11 |
|
-18.28 |
| | |
|
|
|
L |
|
Ørsted |
417.500 |
8/12/24 |
0.63 |
376.000 |
11.04 |
644.800 |
-268.800 |
-41.69 |
|
-4.09 |
| | |
|
|
|
|
|
Tryg |
148.600 |
8/12/24 |
0.61 |
153.100 |
-2.94 |
147.900 |
5.200 |
3.52 |
|
5.77 |
| | |
|
|
|
|
|
ISS |
125.700 |
8/12/24 |
0.48 |
120.900 |
3.97 |
145.350 |
-24.450 |
-16.82 |
|
3.31 |
| | |
|
|
|
|
|
Jyske Bank |
519.000 |
8/12/24 |
0.48 |
552.000 |
-5.98 |
524.000 |
28.000 |
5.34 |
|
7.80 |
| | |
|
|
|
|
|
Coloplast |
884.400 |
8/12/24 |
0.25 |
832.400 |
6.25 |
838.200 |
-5.800 |
-0.69 |
|
4.76 |
| | |
|
|
|
|
|
Danske Bank |
198.450 |
8/12/24 |
0.15 |
209.100 |
-5.09 |
169.200 |
39.900 |
23.58 |
|
14.82 |
| | |
|
|
|
|
|
Novonesis |
429.200 |
8/12/24 |
0.12 |
422.400 |
1.61 |
318.000 |
104.400 |
32.83 |
|
14.99 |
| | |
|
|
|
L |
|
Carlsberg B |
801.600 |
8/12/24 |
|
844.000 |
-5.02 |
1,081.000 |
-237.000 |
-21.92 |
|
0.75 |
| | |
|
|
|
L |
|
DSV |
1,215.500 |
8/12/24 |
|
1,143.500 |
6.30 |
1,430.500 |
-287.000 |
-20.06 |
|
-8.60 |
| | |
|
|
|
L |
|
Rockwool |
2,744.000 |
8/12/24 |
-0.22 |
2,824.000 |
-2.83 |
1,770.500 |
1,053.500 |
59.50 |
|
44.41 |
| | |
|
|
|
L |
|
Ambu |
137.700 |
8/12/24 |
-0.40 |
136.550 |
0.84 |
109.600 |
26.950 |
24.59 |
|
37.16 |
| | |
|
|
|
L |
|
GN Store Nord |
172.000 |
8/12/24 |
-0.98 |
192.300 |
-10.56 |
165.950 |
26.350 |
15.88 |
|
29.59 |
| | |
|
|
|
|
|
Demant |
259.600 |
8/12/24 |
-1.44 |
301.800 |
-13.98 |
280.500 |
21.300 |
7.59 |
|
6.29 |
| | |
|
|
|
|
|
Novo Nordisk |
892.900 |
8/12/24 |
-2.80 |
1,004.600 |
-11.12 |
541.300 |
463.300 |
85.59 |
|
37.87 |
| | |
|
|
|
|
|
Vestas Wind Systems |
152.250 |
8/12/24 |
-7.76 |
162.100 |
-6.08 |
181.300 |
-19.200 |
-10.59 |
|
-1.36 |
| OMXC 20 - 19 out of 19 instruments rated - 7/01/24 / 7/03/23 - 12 did rise, Market-Ratio(52) = 63.16 % |
| Stock Exchange Currency: DKK kr Danish krone |
Technical Chart
Transactions OMX Copenhagen 20 * L52 - 81 ex 1 (1)
|
⇐ |
| |
| L/S | date buy | date sell | days | | instrument | spl | pieces | | prc buy | prc sell | | prc diff | d % | asset | yield | | | long |
1/02/06 |
2/20/06 |
49 |
|
|
|
DSV |
100 |
132 |
|
75.400 |
80.600 |
|
5.200 |
7 |
10,686 |
64 |
|
| |
2/20/06 |
2/27/06 |
7 |
|
|
|
Genmab |
100 |
56 |
|
187.500 |
180.000 |
|
-7.500 |
-4 |
10,266 |
-88 |
|
| |
2/27/06 |
3/06/06 |
7 |
|
|
|
DSV |
100 |
128 |
|
79.700 |
78.900 |
|
-0.800 |
-1 |
10,164 |
-41 |
|
| |
3/06/06 |
4/10/06 |
35 |
|
|
|
Genmab |
100 |
53 |
|
191.000 |
208.500 |
|
17.500 |
9 |
11,092 |
149 |
|
| 4/10/06 |
4/24/06 |
14 |
|
- cash - |
| |
4/24/06 |
5/08/06 |
14 |
|
|
|
Genmab |
100 |
52 |
|
209.500 |
225.000 |
|
15.500 |
7 |
11,898 |
543 |
|
| 5/08/06 |
10/23/06 |
168 |
|
- cash - |
| |
10/23/06 |
10/30/06 |
7 |
|
|
|
Genmab |
100 |
46 |
|
255.000 |
252.000 |
|
-3.000 |
-1 |
11,760 |
-46 |
|
| 10/30/06 |
2/05/07 |
98 |
|
- cash - |
| |
2/05/07 |
2/12/07 |
7 |
|
|
|
Genmab |
100 |
30 |
|
390.000 |
338.000 |
|
-52.000 |
-13 |
10,200 |
-100 |
|
| |
2/12/07 |
2/26/07 |
14 |
|
|
|
Vestas Wind Systems |
100 |
177 |
|
57.500 |
55.200 |
|
-2.300 |
-4 |
9,792 |
-66 |
|
| 2/26/07 |
3/05/07 |
7 |
|
- cash - |
| |
3/05/07 |
3/12/07 |
7 |
|
|
|
Vestas Wind Systems |
100 |
189 |
|
51.800 |
56.100 |
|
4.300 |
8 |
10,605 |
6,295 |
|
| 3/12/07 |
3/26/07 |
14 |
|
- cash - |
| |
3/26/07 |
4/02/07 |
7 |
|
|
|
Vestas Wind Systems |
100 |
172 |
|
61.400 |
62.300 |
|
0.900 |
1 |
10,760 |
114 |
|
| 4/02/07 |
4/09/07 |
7 |
|
- cash - |
| |
4/09/07 |
4/16/07 |
7 |
|
|
|
Vestas Wind Systems |
100 |
168 |
|
63.800 |
66.600 |
|
2.800 |
4 |
11,230 |
839 |
|
| 4/16/07 |
4/30/07 |
14 |
|
- cash - |
| |
4/30/07 |
6/25/07 |
56 |
|
|
|
Vestas Wind Systems |
100 |
156 |
|
71.800 |
71.800 |
|
0.000 |
0 |
11,230 |
0 |
|
| |
6/25/07 |
8/06/07 |
42 |
|
|
|
Rockwool |
100 |
7 |
|
1,602.000 |
1,768.000 |
|
166.000 |
10 |
12,392 |
136 |
|
| 8/06/07 |
8/13/07 |
7 |
|
- cash - |
| |
8/13/07 |
9/10/07 |
28 |
|
|
|
Rockwool |
100 |
6 |
|
1,795.000 |
1,800.000 |
|
5.000 |
0 |
12,422 |
4 |
|
| 9/10/07 |
10/12/09 |
763 |
|
- cash - |
| |
10/12/09 |
10/19/09 |
7 |
|
|
|
GN Store Nord |
100 |
416 |
|
29.800 |
30.000 |
|
0.200 |
1 |
12,506 |
42 |
|
| |
10/19/09 |
10/26/09 |
7 |
|
|
|
Danske Bank |
100 |
100 |
|
124.230 |
117.750 |
|
-6.480 |
-5 |
11,858 |
-94 |
|
| |
10/26/09 |
12/21/09 |
56 |
|
|
|
GN Store Nord |
100 |
408 |
|
29.000 |
27.800 |
|
-1.200 |
-4 |
11,368 |
-24 |
|
| |
12/21/09 |
2/15/10 |
56 |
|
|
|
Danske Bank |
100 |
107 |
|
105.720 |
115.670 |
|
9.950 |
9 |
12,433 |
80 |
|
| |
2/15/10 |
4/26/10 |
70 |
|
|
|
Coloplast |
100 |
102 |
|
120.800 |
124.700 |
|
3.900 |
3 |
12,830 |
18 |
|
| |
4/26/10 |
7/19/10 |
84 |
|
|
|
GN Store Nord |
100 |
295 |
|
43.400 |
41.500 |
|
-1.900 |
-4 |
12,270 |
-18 |
|
| |
7/19/10 |
8/02/10 |
14 |
|
|
|
Novo Nordisk |
100 |
247 |
|
49.480 |
49.610 |
|
0.130 |
0 |
12,302 |
7 |
|
| |
8/02/10 |
8/09/10 |
7 |
|
|
|
Novonesis |
100 |
82 |
|
148.600 |
139.700 |
|
-8.900 |
-6 |
11,572 |
-96 |
|
| 8/09/10 |
8/16/10 |
7 |
|
- cash - |
| |
8/16/10 |
8/23/10 |
7 |
|
|
|
Novo Nordisk |
100 |
231 |
|
50.050 |
49.500 |
|
-0.550 |
-1 |
11,445 |
-44 |
|
| 8/23/10 |
9/13/10 |
21 |
|
- cash - |
| |
9/13/10 |
9/27/10 |
14 |
|
|
|
Novo Nordisk |
100 |
212 |
|
53.850 |
53.650 |
|
-0.200 |
0 |
11,403 |
-9 |
|
| |
9/27/10 |
11/15/10 |
49 |
|
|
|
Carlsberg B |
100 |
19 |
|
580.000 |
557.000 |
|
-23.000 |
-4 |
10,966 |
-26 |
|
| L/S | date buy | date sell | days | | instrument | spl | pieces | | prc buy | prc sell | | prc diff | d % | asset | yield | | | |
11/15/10 |
1/17/11 |
63 |
|
|
|
Novo Nordisk |
100 |
192 |
|
57.050 |
60.950 |
|
3.900 |
7 |
11,715 |
47 |
|
| |
1/17/11 |
2/07/11 |
21 |
|
|
|
GN Store Nord |
100 |
223 |
|
52.300 |
52.650 |
|
0.350 |
1 |
11,793 |
12 |
|
| |
2/07/11 |
2/21/11 |
14 |
|
|
|
Novo Nordisk |
100 |
180 |
|
65.300 |
67.400 |
|
2.100 |
3 |
12,171 |
128 |
|
| 2/21/11 |
2/28/11 |
7 |
|
- cash - |
| |
2/28/11 |
3/07/11 |
7 |
|
|
|
Novo Nordisk |
100 |
179 |
|
67.950 |
67.200 |
|
-0.750 |
-1 |
12,036 |
-44 |
|
| 3/07/11 |
5/16/11 |
70 |
|
- cash - |
| |
5/16/11 |
6/06/11 |
21 |
|
|
|
Novonesis |
100 |
68 |
|
176.500 |
170.500 |
|
-6.000 |
-3 |
11,628 |
-45 |
|
| 6/06/11 |
8/20/12 |
441 |
|
- cash - |
| |
8/20/12 |
11/12/12 |
84 |
|
|
|
Genmab |
100 |
167 |
|
69.500 |
75.600 |
|
6.100 |
9 |
12,647 |
44 |
|
| |
11/12/12 |
2/04/13 |
84 |
|
|
|
Pandora |
100 |
108 |
|
116.300 |
139.100 |
|
22.800 |
20 |
15,109 |
118 |
|
| 2/04/13 |
2/25/13 |
21 |
|
- cash - |
| |
2/25/13 |
3/04/13 |
7 |
|
|
|
Pandora |
100 |
97 |
|
154.300 |
156.000 |
|
1.700 |
1 |
15,274 |
77 |
|
| 3/04/13 |
3/11/13 |
7 |
|
- cash - |
| |
3/11/13 |
4/15/13 |
35 |
|
|
|
Genmab |
100 |
128 |
|
118.600 |
147.400 |
|
28.800 |
24 |
18,961 |
865 |
|
| 4/15/13 |
5/06/13 |
21 |
|
- cash - |
| |
5/06/13 |
5/13/13 |
7 |
|
|
|
Genmab |
100 |
122 |
|
154.700 |
164.900 |
|
10.200 |
7 |
20,205 |
2,692 |
|
| |
5/13/13 |
5/20/13 |
7 |
|
|
|
Pandora |
100 |
97 |
|
207.500 |
200.000 |
|
-7.500 |
-4 |
19,478 |
-85 |
|
| |
5/20/13 |
6/24/13 |
35 |
|
|
|
Genmab |
100 |
99 |
|
195.500 |
168.600 |
|
-26.900 |
-14 |
16,815 |
-79 |
|
| |
6/24/13 |
7/21/14 |
392 |
|
|
|
Vestas Wind Systems |
100 |
1,179 |
|
14.260 |
50.440 |
|
36.180 |
254 |
59,471 |
224 |
|
| |
7/21/14 |
7/28/14 |
7 |
|
|
|
Ambu |
100 |
2,268 |
|
26.219 |
25.500 |
|
-0.719 |
-3 |
57,840 |
-77 |
|
| |
7/28/14 |
9/01/14 |
35 |
|
|
|
Vestas Wind Systems |
100 |
1,116 |
|
51.800 |
47.460 |
|
-4.340 |
-8 |
52,997 |
-60 |
|
| |
9/01/14 |
10/13/14 |
42 |
|
|
|
Pandora |
100 |
124 |
|
426.000 |
444.500 |
|
18.500 |
4 |
55,291 |
45 |
|
| 10/13/14 |
10/27/14 |
14 |
|
- cash - |
| |
10/27/14 |
11/10/14 |
14 |
|
|
|
Pandora |
100 |
115 |
|
479.000 |
507.000 |
|
28.000 |
6 |
58,511 |
340 |
|
| 11/10/14 |
12/08/14 |
28 |
|
- cash - |
| |
12/08/14 |
1/12/15 |
35 |
|
|
|
Genmab |
100 |
181 |
|
323.000 |
389.000 |
|
66.000 |
20 |
70,457 |
595 |
|
| 1/12/15 |
1/26/15 |
14 |
|
- cash - |
| |
1/26/15 |
5/25/15 |
119 |
|
|
|
Genmab |
100 |
163 |
|
431.200 |
577.500 |
|
146.300 |
34 |
94,304 |
145 |
|
| 5/25/15 |
7/20/15 |
56 |
|
- cash - |
| |
7/20/15 |
8/24/15 |
35 |
|
|
|
Genmab |
100 |
137 |
|
684.500 |
548.000 |
|
-136.500 |
-20 |
75,603 |
-90 |
|
| 8/24/15 |
10/12/15 |
49 |
|
- cash - |
| |
10/12/15 |
10/26/15 |
14 |
|
|
|
Genmab |
100 |
123 |
|
611.500 |
668.500 |
|
57.000 |
9 |
82,614 |
921 |
|
| 10/26/15 |
11/16/15 |
21 |
|
- cash - |
| |
11/16/15 |
12/07/15 |
21 |
|
|
|
Genmab |
100 |
111 |
|
744.000 |
950.000 |
|
206.000 |
28 |
105,480 |
6,898 |
|
| 12/07/15 |
1/16/17 |
406 |
|
- cash - |
| |
1/16/17 |
1/23/17 |
7 |
|
|
|
Møller-Mærsk B |
100 |
889 |
|
118.600 |
115.100 |
|
-3.500 |
-3 |
102,369 |
-79 |
|
| 1/23/17 |
2/06/17 |
14 |
|
- cash - |
| |
2/06/17 |
2/20/17 |
14 |
|
|
|
Genmab |
100 |
73 |
|
1,402.000 |
1,395.000 |
|
-7.000 |
0 |
101,858 |
-12 |
|
| 2/20/17 |
3/20/17 |
28 |
|
- cash - |
| |
3/20/17 |
3/27/17 |
7 |
|
|
|
Genmab |
100 |
70 |
|
1,448.000 |
1,383.000 |
|
-65.000 |
-4 |
97,308 |
-91 |
|
| L/S | date buy | date sell | days | | instrument | spl | pieces | | prc buy | prc sell | | prc diff | d % | asset | yield | |
| 3/27/17 |
4/10/17 |
14 |
|
- cash - |
| |
4/10/17 |
4/17/17 |
7 |
|
|
|
Møller-Mærsk A |
100 |
849 |
|
114.500 |
115.000 |
|
0.500 |
0 |
97,732 |
26 |
|
| 4/17/17 |
4/24/17 |
7 |
|
- cash - |
| |
4/24/17 |
5/08/17 |
14 |
|
|
|
GN Store Nord |
100 |
573 |
|
170.300 |
190.800 |
|
20.500 |
12 |
109,479 |
1,836 |
|
| |
5/08/17 |
5/15/17 |
7 |
|
|
|
Ambu |
100 |
1,319 |
|
83.000 |
80.000 |
|
-3.000 |
-4 |
105,522 |
-85 |
|
| |
5/15/17 |
5/29/17 |
14 |
|
|
|
GN Store Nord |
100 |
536 |
|
196.700 |
195.000 |
|
-1.700 |
-1 |
104,611 |
-20 |
|
| |
5/29/17 |
7/10/17 |
42 |
|
|
|
Ambu |
100 |
1,241 |
|
84.280 |
81.420 |
|
-2.860 |
-3 |
101,061 |
-26 |
|
| |
7/10/17 |
7/24/17 |
14 |
|
|
|
Møller-Mærsk B |
100 |
737 |
|
137.100 |
136.100 |
|
-1.000 |
-1 |
100,324 |
-17 |
|
| 7/24/17 |
7/31/17 |
7 |
|
- cash - |
| |
7/31/17 |
8/07/17 |
7 |
|
|
|
Ambu |
100 |
1,224 |
|
81.900 |
82.780 |
|
0.880 |
1 |
101,402 |
75 |
|
| |
8/07/17 |
8/14/17 |
7 |
|
|
|
DSV |
100 |
227 |
|
444.900 |
439.300 |
|
-5.600 |
-1 |
100,130 |
-48 |
|
| 8/14/17 |
8/21/17 |
7 |
|
- cash - |
| |
8/21/17 |
8/28/17 |
7 |
|
|
|
GN Store Nord |
100 |
488 |
|
205.000 |
209.900 |
|
4.900 |
2 |
102,522 |
243 |
|
| |
8/28/17 |
9/18/17 |
21 |
|
|
|
Ambu |
100 |
1,130 |
|
90.680 |
94.240 |
|
3.560 |
4 |
106,544 |
95 |
|
| 9/18/17 |
9/25/17 |
7 |
|
- cash - |
| |
9/25/17 |
11/20/17 |
56 |
|
|
|
Ambu |
100 |
1,095 |
|
97.300 |
109.000 |
|
11.700 |
12 |
119,356 |
110 |
|
| 11/20/17 |
12/04/17 |
14 |
|
- cash - |
| |
12/04/17 |
12/18/17 |
14 |
|
|
|
Ambu |
100 |
1,115 |
|
107.000 |
109.200 |
|
2.200 |
2 |
121,809 |
70 |
|
| 12/18/17 |
7/20/20 |
945 |
|
- cash - |
| |
7/20/20 |
7/27/20 |
7 |
|
|
|
Ambu |
100 |
513 |
|
237.100 |
221.400 |
|
-15.700 |
-7 |
113,755 |
-97 |
|
| 7/27/20 |
8/03/20 |
7 |
|
- cash - |
| |
8/03/20 |
8/17/20 |
14 |
|
|
|
Ambu |
100 |
496 |
|
228.900 |
223.800 |
|
-5.100 |
-2 |
111,225 |
-44 |
|
| 8/17/20 |
11/16/20 |
91 |
|
- cash - |
| |
11/16/20 |
12/14/20 |
28 |
|
|
|
Pandora |
100 |
185 |
|
601.000 |
618.400 |
|
17.400 |
3 |
114,444 |
45 |
|
| 12/14/20 |
1/11/21 |
28 |
|
- cash - |
| |
1/11/21 |
1/18/21 |
7 |
|
|
|
Vestas Wind Systems |
100 |
376 |
|
304.300 |
275.200 |
|
-29.100 |
-10 |
103,503 |
-99 |
|
| |
1/18/21 |
1/25/21 |
7 |
|
|
|
Møller-Mærsk B |
100 |
684 |
|
151.250 |
136.600 |
|
-14.650 |
-10 |
93,482 |
-100 |
|
| 1/25/21 |
3/01/21 |
35 |
|
- cash - |
| |
3/01/21 |
4/26/21 |
56 |
|
|
|
Pandora |
100 |
156 |
|
599.000 |
702.400 |
|
103.400 |
17 |
109,612 |
182 |
|
| |
4/26/21 |
5/03/21 |
7 |
|
|
|
Ambu |
100 |
313 |
|
349.500 |
338.900 |
|
-10.600 |
-3 |
106,295 |
-80 |
|
| |
5/03/21 |
5/17/21 |
14 |
|
|
|
Møller-Mærsk A |
100 |
740 |
|
143.500 |
148.300 |
|
4.800 |
3 |
109,847 |
136 |
|
| |
5/17/21 |
5/24/21 |
7 |
|
|
|
Pandora |
100 |
144 |
|
757.600 |
794.800 |
|
37.200 |
5 |
115,203 |
1,118 |
|
| |
5/24/21 |
7/19/21 |
56 |
|
|
|
Møller-Mærsk A |
100 |
705 |
|
163.300 |
165.700 |
|
2.400 |
1 |
116,895 |
10 |
|
| |
7/19/21 |
8/16/21 |
28 |
|
|
|
Demant |
100 |
328 |
|
356.100 |
348.000 |
|
-8.100 |
-2 |
114,239 |
-26 |
|
| |
8/16/21 |
8/23/21 |
7 |
|
|
|
Møller-Mærsk A |
100 |
650 |
|
175.600 |
171.400 |
|
-4.200 |
-2 |
111,509 |
-72 |
|
| |
8/23/21 |
8/30/21 |
7 |
|
|
|
Novo Nordisk |
100 |
330 |
|
337.200 |
322.100 |
|
-15.100 |
-4 |
106,526 |
-91 |
|
| L/S | date buy | date sell | days | | instrument | spl | pieces | | prc buy | prc sell | | prc diff | d % | asset | yield | | | |
8/30/21 |
9/06/21 |
7 |
|
|
|
Demant |
100 |
297 |
|
358.400 |
364.100 |
|
5.700 |
2 |
108,219 |
128 |
|
| |
9/06/21 |
9/20/21 |
14 |
|
|
|
Møller-Mærsk A |
100 |
597 |
|
181.000 |
176.000 |
|
-5.000 |
-3 |
105,234 |
-52 |
|
| |
9/20/21 |
9/27/21 |
7 |
|
|
|
DSV |
100 |
65 |
|
1,616.500 |
1,571.500 |
|
-45.000 |
-3 |
102,309 |
-77 |
|
| |
9/27/21 |
10/04/21 |
7 |
|
|
|
Møller-Mærsk A |
100 |
568 |
|
180.100 |
155.200 |
|
-24.900 |
-14 |
88,165 |
-100 |
|
| 10/04/21 |
5/30/26 |
1699 |
|
- cash - |
| accum | 1/02/06 |
10/04/21 | 2275 |
days out of 7453 invested (31%) |
782 |
88,165 |
42 |
|
Instrument Related Contribution
| instrument | L/S | date buy | date sell | days | prc buy | prc sell | | prc diff | d % | | | total |
| Vestas Wind Systems | long | 2/12/07 | 2/26/07 | 14 | 57.50 | 55.20 | | -2.30 | -4.00 | | | |
| | | 3/05/07 | 3/12/07 | 7 | 51.80 | 56.10 | | 4.30 | 8.30 | | | |
| | | 3/26/07 | 4/02/07 | 7 | 61.40 | 62.30 | | 0.90 | 1.47 | | | |
| | | 4/09/07 | 4/16/07 | 7 | 63.80 | 66.60 | | 2.80 | 4.39 | | | |
| | | 4/30/07 | 6/25/07 | 56 | 71.80 | 71.80 | | 0.00 | 0.00 | | | |
| | | 6/24/13 | 7/21/14 | 392 | 14.26 | 50.44 | | 36.18 | 253.72 | | | |
| | | 7/28/14 | 9/01/14 | 35 | 51.80 | 47.46 | | -4.34 | -8.38 | | | |
| | | 1/11/21 | 1/18/21 | 7 | 304.30 | 275.20 | | -29.10 | -9.56 | | | 222.76 |
| Genmab | | 2/20/06 | 2/27/06 | 7 | 187.50 | 180.00 | | -7.50 | -4.00 | | | |
| | | 3/06/06 | 4/10/06 | 35 | 191.00 | 208.50 | | 17.50 | 9.16 | | | |
| | | 4/24/06 | 5/08/06 | 14 | 209.50 | 225.00 | | 15.50 | 7.40 | | | |
| | | 10/23/06 | 10/30/06 | 7 | 255.00 | 252.00 | | -3.00 | -1.18 | | | |
| | | 2/05/07 | 2/12/07 | 7 | 390.00 | 338.00 | | -52.00 | -13.33 | | | |
| | | 8/20/12 | 11/12/12 | 84 | 69.50 | 75.60 | | 6.10 | 8.78 | | | |
| | | 3/11/13 | 4/15/13 | 35 | 118.60 | 147.40 | | 28.80 | 24.28 | | | |
| | | 5/06/13 | 5/13/13 | 7 | 154.70 | 164.90 | | 10.20 | 6.59 | | | |
| | | 5/20/13 | 6/24/13 | 35 | 195.50 | 168.60 | | -26.90 | -13.76 | | | |
| | | 12/08/14 | 1/12/15 | 35 | 323.00 | 389.00 | | 66.00 | 20.43 | | | |
| | | 1/26/15 | 5/25/15 | 119 | 431.20 | 577.50 | | 146.30 | 33.93 | | | |
| | | 7/20/15 | 8/24/15 | 35 | 684.50 | 548.00 | | -136.50 | -19.94 | | | |
| | | 10/12/15 | 10/26/15 | 14 | 611.50 | 668.50 | | 57.00 | 9.32 | | | |
| | | 11/16/15 | 12/07/15 | 21 | 744.00 | 950.00 | | 206.00 | 27.69 | | | |
| | | 2/06/17 | 2/20/17 | 14 | 1,402.00 | 1,395.00 | | -7.00 | -0.50 | | | |
| | | 3/20/17 | 3/27/17 | 7 | 1,448.00 | 1,383.00 | | -65.00 | -4.49 | | | 105.21 |
| Pandora | | 11/12/12 | 2/04/13 | 84 | 116.30 | 139.10 | | 22.80 | 19.60 | | | |
| | | 2/25/13 | 3/04/13 | 7 | 154.30 | 156.00 | | 1.70 | 1.10 | | | |
| | | 5/13/13 | 5/20/13 | 7 | 207.50 | 200.00 | | -7.50 | -3.61 | | | |
| | | 9/01/14 | 10/13/14 | 42 | 426.00 | 444.50 | | 18.50 | 4.34 | | | |
| | | 10/27/14 | 11/10/14 | 14 | 479.00 | 507.00 | | 28.00 | 5.85 | | | |
| | | 11/16/20 | 12/14/20 | 28 | 601.00 | 618.40 | | 17.40 | 2.90 | | | |
| | | 3/01/21 | 4/26/21 | 56 | 599.00 | 702.40 | | 103.40 | 17.26 | | | |
| | | 5/17/21 | 5/24/21 | 7 | 757.60 | 794.80 | | 37.20 | 4.91 | | | 62.94 |
| instrument | L/S | date buy | date sell | days | prc buy | prc sell | | prc diff | d % | | | total |
| Rockwool | | 6/25/07 | 8/06/07 | 42 | 1,602.00 | 1,768.00 | | 166.00 | 10.36 | | | |
| | | 8/13/07 | 9/10/07 | 28 | 1,795.00 | 1,800.00 | | 5.00 | 0.28 | | | 10.67 |
| GN Store Nord | | 10/12/09 | 10/19/09 | 7 | 29.80 | 30.00 | | 0.20 | 0.67 | | | |
| | | 10/26/09 | 12/21/09 | 56 | 29.00 | 27.80 | | -1.20 | -4.14 | | | |
| | | 4/26/10 | 7/19/10 | 84 | 43.40 | 41.50 | | -1.90 | -4.38 | | | |
| | | 1/17/11 | 2/07/11 | 21 | 52.30 | 52.65 | | 0.35 | 0.67 | | | |
| | | 4/24/17 | 5/08/17 | 14 | 170.30 | 190.80 | | 20.50 | 12.04 | | | |
| | | 5/15/17 | 5/29/17 | 14 | 196.70 | 195.00 | | -1.70 | -0.86 | | | |
| | | 8/21/17 | 8/28/17 | 7 | 205.00 | 209.90 | | 4.90 | 2.39 | | | 5.65 |
| Danske Bank | | 10/19/09 | 10/26/09 | 7 | 124.23 | 117.75 | | -6.48 | -5.22 | | | |
| | | 12/21/09 | 2/15/10 | 56 | 105.72 | 115.67 | | 9.95 | 9.41 | | | 3.70 |
| Coloplast | | 2/15/10 | 4/26/10 | 70 | 120.80 | 124.70 | | 3.90 | 3.23 | | | 3.23 |
| Novo Nordisk | | 7/19/10 | 8/02/10 | 14 | 49.48 | 49.61 | | 0.13 | 0.26 | | | |
| | | 8/16/10 | 8/23/10 | 7 | 50.05 | 49.50 | | -0.55 | -1.10 | | | |
| | | 9/13/10 | 9/27/10 | 14 | 53.85 | 53.65 | | -0.20 | -0.37 | | | |
| | | 11/15/10 | 1/17/11 | 63 | 57.05 | 60.95 | | 3.90 | 6.84 | | | |
| | | 2/07/11 | 2/21/11 | 14 | 65.30 | 67.40 | | 2.10 | 3.22 | | | |
| | | 2/28/11 | 3/07/11 | 7 | 67.95 | 67.20 | | -0.75 | -1.10 | | | |
| | | 8/23/21 | 8/30/21 | 7 | 337.20 | 322.10 | | -15.10 | -4.48 | | | 2.91 |
| DSV | | 1/02/06 | 2/20/06 | 49 | 75.40 | 80.60 | | 5.20 | 6.90 | | | |
| | | 2/27/06 | 3/06/06 | 7 | 79.70 | 78.90 | | -0.80 | -1.00 | | | |
| | | 8/07/17 | 8/14/17 | 7 | 444.90 | 439.30 | | -5.60 | -1.26 | | | |
| | | 9/20/21 | 9/27/21 | 7 | 1,616.50 | 1,571.50 | | -45.00 | -2.78 | | | 1.58 |
| Demant | | 7/19/21 | 8/16/21 | 28 | 356.10 | 348.00 | | -8.10 | -2.27 | | | |
| | | 8/30/21 | 9/06/21 | 7 | 358.40 | 364.10 | | 5.70 | 1.59 | | | -0.72 |
| instrument | L/S | date buy | date sell | days | prc buy | prc sell | | prc diff | d % | | | total |
| Ambu | | 7/21/14 | 7/28/14 | 7 | 26.22 | 25.50 | | -0.72 | -2.74 | | | |
| | | 5/08/17 | 5/15/17 | 7 | 83.00 | 80.00 | | -3.00 | -3.61 | | | |
| | | 5/29/17 | 7/10/17 | 42 | 84.28 | 81.42 | | -2.86 | -3.39 | | | |
| | | 7/31/17 | 8/07/17 | 7 | 81.90 | 82.78 | | 0.88 | 1.07 | | | |
| | | 8/28/17 | 9/18/17 | 21 | 90.68 | 94.24 | | 3.56 | 3.93 | | | |
| | | 9/25/17 | 11/20/17 | 56 | 97.30 | 109.00 | | 11.70 | 12.02 | | | |
| | | 12/04/17 | 12/18/17 | 14 | 107.00 | 109.20 | | 2.20 | 2.06 | | | |
| | | 7/20/20 | 7/27/20 | 7 | 237.10 | 221.40 | | -15.70 | -6.62 | | | |
| | | 8/03/20 | 8/17/20 | 14 | 228.90 | 223.80 | | -5.10 | -2.23 | | | |
| | | 4/26/21 | 5/03/21 | 7 | 349.50 | 338.90 | | -10.60 | -3.03 | | | -3.72 |
| Carlsberg B | | 9/27/10 | 11/15/10 | 49 | 580.00 | 557.00 | | -23.00 | -3.97 | | | -3.97 |
| Novonesis | | 8/02/10 | 8/09/10 | 7 | 148.60 | 139.70 | | -8.90 | -5.99 | | | |
| | | 5/16/11 | 6/06/11 | 21 | 176.50 | 170.50 | | -6.00 | -3.40 | | | -9.19 |
| Møller-Mærsk B | | 1/16/17 | 1/23/17 | 7 | 118.60 | 115.10 | | -3.50 | -2.95 | | | |
| | | 7/10/17 | 7/24/17 | 14 | 137.10 | 136.10 | | -1.00 | -0.73 | | | |
| | | 1/18/21 | 1/25/21 | 7 | 151.25 | 136.60 | | -14.65 | -9.69 | | | -12.99 |
| Møller-Mærsk A | | 4/10/17 | 4/17/17 | 7 | 114.50 | 115.00 | | 0.50 | 0.44 | | | |
| | | 5/03/21 | 5/17/21 | 14 | 143.50 | 148.30 | | 4.80 | 3.34 | | | |
| | | 5/24/21 | 7/19/21 | 56 | 163.30 | 165.70 | | 2.40 | 1.47 | | | |
| | | 8/16/21 | 8/23/21 | 7 | 175.60 | 171.40 | | -4.20 | -2.39 | | | |
| | | 9/06/21 | 9/20/21 | 14 | 181.00 | 176.00 | | -5.00 | -2.76 | | | |
| | | 9/27/21 | 10/04/21 | 7 | 180.10 | 155.20 | | -24.90 | -13.83 | | | -13.86 |
Annotations
| 9/13/23 | Novo Nordisk | | | stock split 1:2 (two for one) |
| 6/18/18 | OMXC 20 | | | Ambu, FLSmidth and Tryg replace Møller-Mærsk A, Nordea Bank and TDC |
| 2/14/18 | OMXC 20 | | | Nordea Bank replaces Nets (acquired by Evergood 5) |
| 3/22/17 | OMXC 20 | | | index adaption: Dong Energy, Lundbeck and Nets for FlSmidth, Nordea and Tryg |
| 5/25/16 | William Demant | | | forward stock split 1:5 (five for one) |
| 9/16/15 | OMXC 20 | | | complete analysis
it was really a pleasure,
this combination of instruments seems to have been built for Share-o-matic |
| 5/18/15 | Tryg | | | forward stock split 1:5 (five for one) |
|
|