| | Mittwoch, 1. April 2026, 4:38UTC |
| | |

Auswertung - Toronto Stock Exchange 60 in Schweizer Franken - 1.07.24 - RS = 8
⇐
| |
|
⇓Wertpapier |
jüngster |
⇓ ΔTag |
1.07.24 |
⇓ ΔWo |
6.05.24 |
K-Diff |
Δ8 |
|
⇓∅-RS |
| |  |
 |
 |
|
|
 |
TSX 60 |
882,515 |
12.08.24 |
0,21 |
858,008 |
2,86 |
884,838 |
-26,831 |
-3,03 |
|
4,83 |
| | |
|
|
|
L |
|
Kinross Gold |
8,055 |
12.08.24 |
5,15 |
7,490 |
7,55 |
6,114 |
1,376 |
22,50 |
|
51,95 |
| | |
|
|
|
L |
|
Gildan Activewear |
37,482 |
12.08.24 |
-0,42 |
34,122 |
9,85 |
29,981 |
4,141 |
13,81 |
|
17,80 |
| | |
|
|
|
L |
|
Saputo |
19,333 |
12.08.24 |
-4,05 |
20,201 |
-4,30 |
17,819 |
2,382 |
13,37 |
|
11,71 |
| | |
|
|
|
|
|
Manulife Financial |
22,568 |
12.08.24 |
-0,35 |
23,956 |
-5,79 |
22,162 |
1,793 |
8,09 |
|
28,44 |
| | |
|
|
|
L |
|
Dollarama |
84,775 |
12.08.24 |
1,46 |
82,138 |
3,21 |
78,159 |
3,979 |
5,09 |
|
26,23 |
| | |
|
|
|
|
|
Waste Connections |
162,652 |
12.08.24 |
-0,11 |
157,838 |
3,05 |
150,959 |
6,879 |
4,56 |
|
19,26 |
| | |
|
|
|
|
|
Constellation Soft |
2.603,706 |
12.08.24 |
-2,83 |
2.592,093 |
0,45 |
2.486,811 |
105,282 |
4,23 |
|
23,13 |
| | |
|
|
|
L |
|
Royal Bank CA |
97,821 |
12.08.24 |
-0,72 |
95,776 |
2,14 |
92,270 |
3,506 |
3,80 |
|
13,57 |
| | |
|
|
|
L |
|
George Weston |
137,098 |
12.08.24 |
0,64 |
129,405 |
5,95 |
125,222 |
4,183 |
3,34 |
|
18,70 |
| | |
|
|
|
L |
|
Metro (CA) |
52,218 |
12.08.24 |
-0,43 |
49,838 |
4,78 |
48,244 |
1,594 |
3,30 |
|
6,50 |
| | |
|
|
|
|
|
Pembina Pipeline |
34,326 |
12.08.24 |
-1,69 |
33,379 |
2,84 |
32,521 |
0,858 |
2,64 |
|
13,57 |
| | |
|
|
|
|
|
Loblaw |
109,007 |
12.08.24 |
0,48 |
104,358 |
4,45 |
103,106 |
1,251 |
1,21 |
|
22,35 |
| | |
|
|
|
|
|
Couche-Tard |
53,001 |
12.08.24 |
0,89 |
50,482 |
4,99 |
49,902 |
0,580 |
1,16 |
|
2,55 |
| | |
|
|
|
|
|
FirstService |
151,914 |
12.08.24 |
-0,57 |
136,908 |
10,96 |
136,615 |
0,293 |
0,21 |
|
-0,40 |
| | |
|
|
|
L |
|
Thomson Reuters (CA) |
145,200 |
12.08.24 |
-0,41 |
151,644 |
-4,25 |
151,470 |
0,174 |
0,12 |
|
19,68 |
| | |
|
|
|
L |
|
TC Energy |
39,323 |
12.08.24 |
0,57 |
34,102 |
15,31 |
34,079 |
0,023 |
0,07 |
|
2,01 |
| | |
|
|
|
L |
|
CCL Industries |
48,260 |
12.08.24 |
-0,72 |
47,306 |
2,02 |
47,408 |
-0,102 |
-0,22 |
|
15,80 |
| | |
|
|
|
|
|
Hydro One |
28,776 |
12.08.24 |
-0,09 |
26,204 |
9,81 |
26,327 |
-0,122 |
-0,47 |
|
4,50 |
| | |
|
|
|
|
|
Barrick Gold |
17,196 |
12.08.24 |
9,37 |
15,006 |
14,59 |
15,113 |
-0,107 |
-0,71 |
|
3,48 |
| | |
|
|
|
S |
|
Toronto-Dominion |
51,626 |
12.08.24 |
0,19 |
49,450 |
4,40 |
49,822 |
-0,372 |
-0,75 |
|
-7,11 |
| | |
|
|
|
S |
|
Open Text |
26,908 |
12.08.24 |
-1,49 |
27,013 |
-0,39 |
27,375 |
-0,361 |
-1,32 |
|
-18,16 |
| | |
|
|
|
L |
|
Cdn Tire |
98,150 |
12.08.24 |
-0,17 |
89,260 |
9,96 |
90,593 |
-1,333 |
-1,47 |
|
-6,53 |
| | |
|
|
|
|
|
Agnico-Eagle Mines |
69,342 |
12.08.24 |
3,52 |
58,840 |
17,85 |
59,942 |
-1,102 |
-1,84 |
|
25,90 |
| | |
|
|
|
|
|
Power Canada |
24,626 |
12.08.24 |
2,02 |
25,001 |
-1,50 |
25,584 |
-0,583 |
-2,28 |
|
2,07 |
| |
|
⇓Wertpapier |
jüngster |
⇓ ΔTag |
1.07.24 |
⇓ ΔWo |
6.05.24 |
K-Diff |
Δ8 |
|
⇓∅-RS |
| | |
|
|
|
|
|
Imperial Oil |
67,915 |
12.08.24 |
3,95 |
61,339 |
10,72 |
62,780 |
-1,441 |
-2,30 |
|
16,50 |
| | |
|
|
|
|
|
Cdn Imp Bk Comm |
45,827 |
12.08.24 |
-0,36 |
42,775 |
7,13 |
43,841 |
-1,065 |
-2,43 |
|
10,21 |
| | |
|
|
|
|
|
Intact Financial |
163,224 |
12.08.24 |
0,94 |
149,934 |
8,86 |
153,864 |
-3,929 |
-2,55 |
|
9,25 |
| | |
|
|
|
|
|
Suncor Energy |
36,640 |
12.08.24 |
2,28 |
34,293 |
6,85 |
35,233 |
-0,940 |
-2,67 |
|
14,76 |
| | |
|
|
|
S |
|
Cdn Apartment Props |
32,267 |
12.08.24 |
-0,30 |
29,229 |
10,39 |
30,034 |
-0,805 |
-2,68 |
|
-5,21 |
| | |
|
|
|
L |
|
First Quantum |
10,495 |
12.08.24 |
2,77 |
11,817 |
-11,19 |
12,182 |
-0,365 |
-3,00 |
|
3,57 |
| | |
|
|
|
L |
|
Wheaton Precious |
51,692 |
12.08.24 |
2,56 |
47,168 |
9,59 |
48,728 |
-1,560 |
-3,20 |
|
15,14 |
| | |
|
|
|
|
|
WSP Global |
139,663 |
12.08.24 |
0,19 |
140,084 |
-0,30 |
145,150 |
-5,066 |
-3,49 |
|
9,45 |
| | |
|
|
|
|
|
Cameco |
35,332 |
12.08.24 |
-1,09 |
44,262 |
-20,18 |
45,969 |
-1,708 |
-3,72 |
|
20,36 |
| | |
|
|
|
|
|
Fortis (CA) |
38,639 |
12.08.24 |
-0,39 |
34,963 |
10,51 |
36,321 |
-1,357 |
-3,74 |
|
-2,00 |
| | |
|
|
|
|
|
Enbridge |
35,299 |
12.08.24 |
0,60 |
32,004 |
10,29 |
33,250 |
-1,246 |
-3,75 |
|
2,57 |
| | |
|
|
|
|
|
Cdn Pac Kansas City |
69,795 |
12.08.24 |
-0,66 |
70,847 |
-1,49 |
73,895 |
-3,047 |
-4,12 |
|
0,88 |
| | |
|
|
|
L |
|
BCE |
31,459 |
12.08.24 |
-0,40 |
29,137 |
7,97 |
30,412 |
-1,275 |
-4,19 |
|
-13,81 |
| | |
|
|
|
|
|
Bank Nova Scotia |
40,434 |
12.08.24 |
-3,42 |
41,151 |
-1,74 |
42,985 |
-1,834 |
-4,27 |
|
-1,07 |
| | |
|
|
|
S |
|
CGI Group |
95,763 |
12.08.24 |
-0,70 |
89,792 |
6,65 |
94,014 |
-4,222 |
-4,49 |
|
-3,24 |
| | |
|
|
|
|
|
Teck Resources |
41,967 |
12.08.24 |
2,36 |
43,111 |
-2,65 |
45,200 |
-2,089 |
-4,62 |
|
16,45 |
| | |
|
|
|
|
|
Emera |
32,096 |
12.08.24 |
-0,69 |
30,018 |
6,92 |
31,606 |
-1,587 |
-5,02 |
|
-6,62 |
| | |
|
|
|
|
|
Rogers Comm |
35,621 |
12.08.24 |
-0,79 |
33,273 |
7,06 |
35,127 |
-1,854 |
-5,28 |
|
-10,67 |
| | |
|
|
|
|
|
Brookfield Asset |
35,378 |
12.08.24 |
-1,08 |
34,247 |
3,30 |
36,215 |
-1,968 |
-5,43 |
|
6,28 |
| | |
|
|
|
|
|
Brookfield Corp |
39,902 |
12.08.24 |
-1,65 |
37,416 |
6,64 |
39,590 |
-2,174 |
-5,49 |
|
14,58 |
| | |
|
|
|
|
|
Cenovus Energy |
17,169 |
12.08.24 |
3,28 |
17,682 |
-2,90 |
18,754 |
-1,072 |
-5,71 |
|
8,33 |
| | |
|
|
|
|
|
National Bank CA |
75,240 |
12.08.24 |
0,39 |
71,354 |
5,45 |
75,685 |
-4,331 |
-5,72 |
|
8,05 |
| | |
|
|
|
|
|
Nutrien |
41,743 |
12.08.24 |
0,51 |
45,800 |
-8,86 |
48,940 |
-3,140 |
-6,42 |
|
-8,56 |
| | |
|
|
|
|
|
Franco-Nevada |
112,005 |
12.08.24 |
2,47 |
106,659 |
5,01 |
114,386 |
-7,727 |
-6,76 |
|
-2,14 |
| | |
|
|
|
|
|
Cdn Nat Resources |
32,287 |
12.08.24 |
2,68 |
32,044 |
0,76 |
34,441 |
-2,397 |
-6,96 |
|
9,69 |
| |
|
⇓Wertpapier |
jüngster |
⇓ ΔTag |
1.07.24 |
⇓ ΔWo |
6.05.24 |
K-Diff |
Δ8 |
|
⇓∅-RS |
| | |
|
|
|
|
|
Cdn Nat Railway |
100,083 |
12.08.24 |
-0,01 |
106,304 |
-5,85 |
114,380 |
-8,076 |
-7,06 |
|
-0,25 |
| | |
|
|
|
S |
|
Restaurant Brands |
63,101 |
12.08.24 |
-0,84 |
63,391 |
-0,46 |
68,304 |
-4,914 |
-7,19 |
|
-1,67 |
| | |
|
|
|
|
|
Tourmaline Oil |
39,935 |
12.08.24 |
4,20 |
40,803 |
-2,13 |
44,371 |
-3,569 |
-8,04 |
|
-3,65 |
| | |
|
|
|
S |
|
Sun Life Financial |
43,361 |
12.08.24 |
-0,11 |
44,110 |
-1,70 |
48,178 |
-4,067 |
-8,44 |
|
-2,19 |
| | |
|
|
|
S |
|
Telus |
14,822 |
12.08.24 |
0,09 |
13,618 |
8,84 |
14,908 |
-1,289 |
-8,65 |
|
-10,72 |
| | |
|
|
|
|
|
Brookfield Infra |
27,119 |
12.08.24 |
-0,27 |
24,712 |
9,74 |
27,408 |
-2,696 |
-9,84 |
|
-6,25 |
| | |
|
|
|
S |
|
Bank Montreal |
73,550 |
12.08.24 |
-0,10 |
75,510 |
-2,60 |
84,339 |
-8,829 |
-10,47 |
|
-4,52 |
| | |
|
|
|
S |
|
Magna |
34,378 |
12.08.24 |
-1,88 |
37,706 |
-8,82 |
42,209 |
-4,504 |
-10,67 |
|
-20,65 |
| | |
|
|
|
|
|
CAE |
14,874 |
12.08.24 |
-0,92 |
16,709 |
-10,98 |
18,814 |
-2,104 |
-11,19 |
|
-9,97 |
| | |
|
|
|
|
|
Algonquin |
4,649 |
12.08.24 |
-4,72 |
5,287 |
-12,06 |
6,068 |
-0,781 |
-12,87 |
|
-6,63 |
| | |
|
|
|
|
|
Shopify |
61,747 |
12.08.24 |
-1,29 |
59,452 |
3,86 |
70,081 |
-10,630 |
-15,17 |
|
1,00 |
| TSX 60 - 60 von 60 Wertpapieren bewertet - 1.07.24 / 6.05.24 - 16 davon sind besser, Markt-Kennzahl(8) in CHF = 26,67 % |
| Börsenplatz-Währung: CAD $ Kanadischer Dollar |
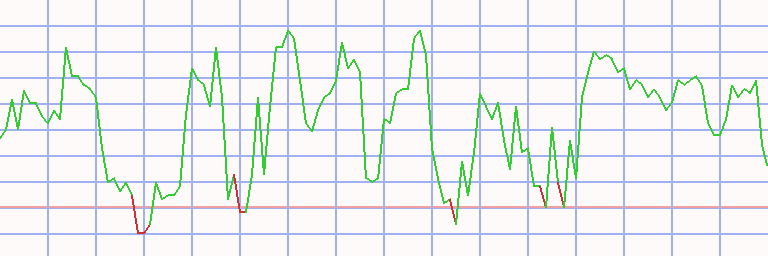
Technischer Chart
Transaktionen Toronto Stock Exchange 60 in Schweizer Franken * L8 - 19 ex 18 (1)
|
⇐ |
| |
| L/S | K-Datum | V-Datum | Tage | | Wertpapier | Spl | Stück | | K-Kurs | V-Kurs | | K-Diff | D % | Kapital | Rdte | | | long |
2.01.06 |
12.06.06 |
161 |
|
|
|
Wheaton Precious |
100 |
1.260 |
|
7,936 |
10,003 |
|
2,067 |
26 |
12.604 |
69 |
|
| 12.06.06 |
3.07.06 |
21 |
|
- cash - |
| |
3.07.06 |
5.03.07 |
245 |
|
|
|
Agnico-Eagle Mines |
100 |
307 |
|
41,016 |
44,387 |
|
3,371 |
8 |
13.639 |
12 |
|
| |
5.03.07 |
13.08.07 |
161 |
|
|
|
Rogers Comm |
100 |
378 |
|
36,070 |
47,906 |
|
11,837 |
33 |
18.113 |
90 |
|
| 13.08.07 |
20.08.07 |
7 |
|
- cash - |
| |
20.08.07 |
26.11.07 |
98 |
|
|
|
Rogers Comm |
100 |
360 |
|
50,274 |
42,997 |
|
-7,278 |
-14 |
15.494 |
-44 |
|
| |
26.11.07 |
12.05.08 |
168 |
|
|
|
Saputo |
100 |
999 |
|
15,504 |
13,089 |
|
-2,415 |
-16 |
13.081 |
-31 |
|
| |
12.05.08 |
14.07.08 |
63 |
|
|
|
Cdn Nat Resources |
100 |
501 |
|
26,101 |
21,447 |
|
-4,654 |
-18 |
10.750 |
-68 |
|
| 14.07.08 |
11.08.08 |
28 |
|
- cash - |
| |
11.08.08 |
29.09.08 |
49 |
|
|
|
Open Text |
100 |
1.137 |
|
9,449 |
9,023 |
|
-0,426 |
-5 |
10.265 |
-29 |
|
| 29.09.08 |
1.12.08 |
63 |
|
- cash - |
| |
1.12.08 |
15.06.09 |
196 |
|
|
|
Metro (CA) |
100 |
910 |
|
11,274 |
11,348 |
|
0,074 |
1 |
10.333 |
1 |
|
| |
15.06.09 |
17.05.10 |
336 |
|
|
|
Teck Resources |
100 |
568 |
|
18,160 |
36,736 |
|
18,576 |
102 |
20.884 |
115 |
|
| |
17.05.10 |
28.03.11 |
315 |
|
|
|
Magna |
100 |
1.050 |
|
19,875 |
21,983 |
|
2,108 |
11 |
23.098 |
12 |
|
| |
28.03.11 |
22.08.11 |
147 |
|
|
|
First Quantum |
100 |
947 |
|
24,380 |
15,915 |
|
-8,465 |
-35 |
15.081 |
-65 |
|
| |
22.08.11 |
26.12.11 |
126 |
|
|
|
Franco-Nevada |
100 |
429 |
|
35,115 |
35,176 |
|
0,061 |
0 |
15.107 |
1 |
|
| |
26.12.11 |
17.12.12 |
357 |
|
|
|
Dollarama |
100 |
2.220 |
|
6,804 |
9,039 |
|
2,235 |
33 |
20.068 |
34 |
|
| |
17.12.12 |
17.03.14 |
455 |
|
|
|
Gildan Activewear |
100 |
1.220 |
|
16,442 |
21,179 |
|
4,737 |
29 |
25.848 |
23 |
|
| |
17.03.14 |
18.01.16 |
672 |
|
|
|
Constellation Soft |
100 |
124 |
|
207,646 |
339,615 |
|
131,969 |
64 |
42.212 |
31 |
|
| 18.01.16 |
25.01.16 |
7 |
|
- cash - |
| |
25.01.16 |
4.07.16 |
161 |
|
|
|
CCL Industries |
100 |
1.396 |
|
30,219 |
33,431 |
|
3,212 |
11 |
46.696 |
26 |
|
| |
4.07.16 |
21.11.16 |
140 |
|
|
|
Barrick Gold |
100 |
2.152 |
|
21,697 |
15,526 |
|
-6,171 |
-28 |
33.415 |
-58 |
|
| |
21.11.16 |
8.05.17 |
168 |
|
|
|
Teck Resources |
100 |
1.388 |
|
24,059 |
18,233 |
|
-5,826 |
-24 |
25.329 |
-45 |
|
| |
8.05.17 |
5.02.18 |
273 |
|
|
|
Shopify |
100 |
2.924 |
|
8,662 |
11,184 |
|
2,522 |
29 |
32.703 |
41 |
|
| 5.02.18 |
26.02.18 |
21 |
|
- cash - |
| |
26.02.18 |
26.03.18 |
28 |
|
|
|
First Quantum |
100 |
2.063 |
|
15,848 |
13,350 |
|
-2,497 |
-16 |
27.551 |
-89 |
|
| 26.03.18 |
2.04.18 |
7 |
|
- cash - |
| |
2.04.18 |
23.07.18 |
112 |
|
|
|
First Quantum |
100 |
2.050 |
|
13,436 |
13,464 |
|
0,028 |
0 |
27.608 |
1 |
|
| |
23.07.18 |
15.10.18 |
84 |
|
|
|
Shopify |
100 |
1.605 |
|
17,200 |
13,407 |
|
-3,793 |
-22 |
21.520 |
-66 |
|
| 15.10.18 |
5.11.18 |
21 |
|
- cash - |
| |
5.11.18 |
4.03.19 |
119 |
|
|
|
Cameco |
100 |
1.770 |
|
12,157 |
11,445 |
|
-0,712 |
-6 |
20.260 |
-17 |
|
| |
4.03.19 |
16.03.20 |
378 |
|
|
|
Shopify |
100 |
1.088 |
|
18,617 |
31,042 |
|
12,426 |
67 |
33.779 |
64 |
|
| 16.03.20 |
20.04.20 |
35 |
|
- cash - |
| |
20.04.20 |
8.03.21 |
322 |
|
|
|
Shopify |
100 |
554 |
|
60,912 |
101,008 |
|
40,096 |
66 |
55.992 |
77 |
|
| L/S | K-Datum | V-Datum | Tage | | Wertpapier | Spl | Stück | | K-Kurs | V-Kurs | | K-Diff | D % | Kapital | Rdte | | | |
8.03.21 |
23.08.21 |
168 |
|
|
|
First Quantum |
100 |
2.857 |
|
19,595 |
18,053 |
|
-1,543 |
-8 |
51.585 |
-16 |
|
| |
23.08.21 |
7.02.22 |
168 |
|
|
|
WSP Global |
100 |
436 |
|
118,167 |
119,911 |
|
1,744 |
1 |
52.345 |
3 |
|
| |
7.02.22 |
13.06.22 |
126 |
|
|
|
Cenovus Energy |
100 |
3.669 |
|
14,265 |
22,515 |
|
8,250 |
58 |
82.614 |
275 |
|
| 13.06.22 |
4.07.22 |
21 |
|
- cash - |
| |
4.07.22 |
10.10.22 |
98 |
|
|
|
Cenovus Energy |
100 |
4.479 |
|
18,442 |
18,553 |
|
0,111 |
1 |
83.109 |
2 |
|
| 10.10.22 |
24.10.22 |
14 |
|
- cash - |
| |
24.10.22 |
2.01.23 |
70 |
|
|
|
Tourmaline Oil |
100 |
1.517 |
|
54,780 |
43,318 |
|
-11,463 |
-21 |
65.720 |
-71 |
|
| |
2.01.23 |
26.06.23 |
175 |
|
|
|
Restaurant Brands |
100 |
1.100 |
|
59,709 |
67,458 |
|
7,749 |
13 |
74.244 |
29 |
|
| 26.06.23 |
3.07.23 |
7 |
|
- cash - |
| |
3.07.23 |
9.10.23 |
98 |
|
|
|
Shopify |
100 |
1.282 |
|
57,895 |
48,855 |
|
-9,040 |
-16 |
62.655 |
-47 |
|
| 9.10.23 |
16.10.23 |
7 |
|
- cash - |
| |
16.10.23 |
30.10.23 |
14 |
|
|
|
Cameco |
100 |
1.922 |
|
32,591 |
34,170 |
|
1,579 |
5 |
65.689 |
243 |
|
| 30.10.23 |
6.11.23 |
7 |
|
- cash - |
| |
6.11.23 |
12.08.24 |
280 |
|
|
|
Cameco |
100 |
1.789 |
|
36,702 |
35,332 |
|
-1,370 |
-4 |
63.238 |
-5 |
|
| kum | 2.01.06 |
12.08.24 | 7128 |
Tage von 7394 investiert (96%) |
532 |
63.238 |
10 |
|
Anteil der Einzelwerte
| Wertpapier | L/S | K-Datum | V-Datum | Tage | K-Kurs | V-Kurs | | K-Diff | D % | | | Summe |
| Shopify | long | 8.05.17 | 5.02.18 | 273 | 8,66 | 11,18 | | 2,52 | 29,12 | | | |
| | | 23.07.18 | 15.10.18 | 84 | 17,20 | 13,41 | | -3,79 | -22,05 | | | |
| | | 4.03.19 | 16.03.20 | 378 | 18,62 | 31,04 | | 12,43 | 66,74 | | | |
| | | 20.04.20 | 8.03.21 | 322 | 60,91 | 101,01 | | 40,10 | 65,83 | | | |
| | | 3.07.23 | 9.10.23 | 98 | 57,90 | 48,86 | | -9,04 | -15,61 | | | 134,83 |
| Constellation Soft | | 17.03.14 | 18.01.16 | 672 | 207,65 | 339,62 | | 131,97 | 63,55 | | | 63,55 |
| Cenovus Energy | | 7.02.22 | 13.06.22 | 126 | 14,27 | 22,51 | | 8,25 | 57,83 | | | |
| | | 4.07.22 | 10.10.22 | 98 | 18,44 | 18,55 | | 0,11 | 0,60 | | | 58,78 |
| Teck Resources | | 15.06.09 | 17.05.10 | 336 | 18,16 | 36,74 | | 18,58 | 102,29 | | | |
| | | 21.11.16 | 8.05.17 | 168 | 24,06 | 18,23 | | -5,83 | -24,21 | | | 53,31 |
| Dollarama | | 26.12.11 | 17.12.12 | 357 | 6,80 | 9,04 | | 2,23 | 32,84 | | | 32,84 |
| Gildan Activewear | | 17.12.12 | 17.03.14 | 455 | 16,44 | 21,18 | | 4,74 | 28,81 | | | 28,81 |
| Wheaton Precious | | 2.01.06 | 12.06.06 | 161 | 7,94 | 10,00 | | 2,07 | 26,04 | | | 26,04 |
| Rogers Comm | | 5.03.07 | 13.08.07 | 161 | 36,07 | 47,91 | | 11,84 | 32,82 | | | |
| | | 20.08.07 | 26.11.07 | 98 | 50,27 | 43,00 | | -7,28 | -14,48 | | | 13,59 |
| Restaurant Brands | | 2.01.23 | 26.06.23 | 175 | 59,71 | 67,46 | | 7,75 | 12,98 | | | 12,98 |
| CCL Industries | | 25.01.16 | 4.07.16 | 161 | 30,22 | 33,43 | | 3,21 | 10,63 | | | 10,63 |
| Magna | | 17.05.10 | 28.03.11 | 315 | 19,87 | 21,98 | | 2,11 | 10,61 | | | 10,61 |
| Agnico-Eagle Mines | | 3.07.06 | 5.03.07 | 245 | 41,02 | 44,39 | | 3,37 | 8,22 | | | 8,22 |
| WSP Global | | 23.08.21 | 7.02.22 | 168 | 118,17 | 119,91 | | 1,74 | 1,48 | | | 1,48 |
| Metro (CA) | | 1.12.08 | 15.06.09 | 196 | 11,27 | 11,35 | | 0,07 | 0,66 | | | 0,66 |
| Franco-Nevada | | 22.08.11 | 26.12.11 | 126 | 35,11 | 35,18 | | 0,06 | 0,17 | | | 0,17 |
| Open Text | | 11.08.08 | 29.09.08 | 49 | 9,45 | 9,02 | | -0,43 | -4,51 | | | -4,51 |
| Cameco | | 5.11.18 | 4.03.19 | 119 | 12,16 | 11,45 | | -0,71 | -5,85 | | | |
| | | 16.10.23 | 30.10.23 | 14 | 32,59 | 34,17 | | 1,58 | 4,84 | | | |
| | | 6.11.23 | 12.08.24 | 280 | 36,70 | 35,33 | | -1,37 | -3,73 | | | -4,98 |
| Wertpapier | L/S | K-Datum | V-Datum | Tage | K-Kurs | V-Kurs | | K-Diff | D % | | | Summe |
| Saputo | | 26.11.07 | 12.05.08 | 168 | 15,50 | 13,09 | | -2,41 | -15,58 | | | -15,58 |
| Cdn Nat Resources | | 12.05.08 | 14.07.08 | 63 | 26,10 | 21,45 | | -4,65 | -17,83 | | | -17,83 |
| Tourmaline Oil | | 24.10.22 | 2.01.23 | 70 | 54,78 | 43,32 | | -11,46 | -20,92 | | | -20,92 |
| Barrick Gold | | 4.07.16 | 21.11.16 | 140 | 21,70 | 15,53 | | -6,17 | -28,44 | | | -28,44 |
| First Quantum | | 28.03.11 | 22.08.11 | 147 | 24,38 | 15,92 | | -8,47 | -34,72 | | | |
| | | 26.02.18 | 26.03.18 | 28 | 15,85 | 13,35 | | -2,50 | -15,76 | | | |
| | | 2.04.18 | 23.07.18 | 112 | 13,44 | 13,46 | | 0,03 | 0,21 | | | |
| | | 8.03.21 | 23.08.21 | 168 | 19,60 | 18,05 | | -1,54 | -7,87 | | | -49,23 |
Anmerkungen
| 11.06.24 | Cdn Nat Resources | | | Aktiensplit 1:2 (zwei für eine) |
| 16.05.22 | Cdn Imp Bk Comm | | | Aktiensplit 1:2 (zwei für eine) |
| 15.05.21 | Cdn Pac Railway | | | Aktiensplit 1:5 (fünf für eine) |
| 30.09.19 | Couche-Tard | | | Aktien-Split 1:2 (zwei für eine) |
| 18.04.19 | TSX 60 | | | Canopy Growth ersetzt Goldcorp (fusioniert mit Newmont) |
| 2.01.18 | Nutrien | | | Fusion von Agrium mit Potash |
| 22.05.17 | Silver Wheaton | | | heißt jetzt Wheaton Precious Metals |
| 9.06.16 | TSX 60 | | | vollständige Analyse |
| 8.06.16 | TSX 60 | | | Index-Anpassung: Dollarama ersetzt TransAlta |
| 23.02.16 | TSX 60 | | | Emera ersetzt Canadian Oil Sands (übernommen von Suncor) |
| 17.08.15 | TSX 60 | | | vollständige Analyse |
| 15.08.15 | TSX 60 | | | Komponenten-Korrektur: ARC Energy Trust (AET-UN) durch ARC Resources (ARX) ersetzt |
| 3.08.15 | TSX 60 | | | Constellation Software ersetzt Catamaran (übernommen von UnitedHealth) |
| 12.05.15 | Brookfield Ass Mgmt | | | Aktiensplit 2:3 (drei für zwei - eine halbe Bonus-Aktie für eine) |
| 11.05.15 | TSX 60 | | | Franco-Nevada ersetzt Talisman Energy. |
| | TSX 60 | | | Talisman Energy scheidet wegen der Übernahme durch Repsol aus. |
| 30.03.15 | Gildan Activewear | | | Aktien-Split 1:2 (zwei für eine) |
| 26.03.15 | Magna | | | Aktien-Split 1:2 (zwei für eine) |
| 12.02.15 | Metro (CA) | | | Aktien-Split 1:3 (drei für eine) |
|
|