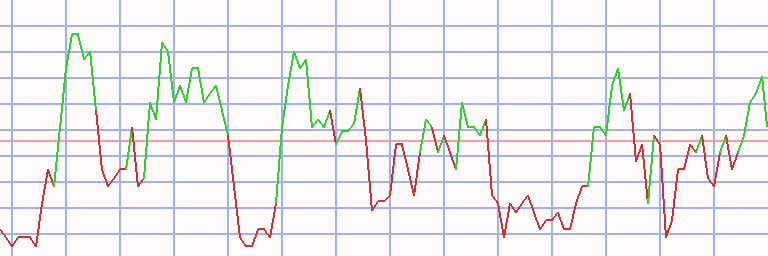
Assessment - Photon Photovoltaik-Aktienindex in Japanese yen - 7/01/24 - RS = 9
⇐
⇓ freshest
Δday
7/01/24
⇓ 4/29/24
prc diff
⇓
⇓
L
SOM Price Index
395,251.513
8/12/24
-1.07
418,248.406
-5.50
427,208.578
-8,960.173
-2.10
-15.29
L
First Solar
35,421.968
8/12/24
3.51
35,984.247
-1.56
28,211.505
7,772.743
27.55
41.66
L
Xinte Energy
155.999
8/12/24
1.62
167.585
-6.91
175.495
-7.910
-4.51
-21.12
L
Solaria Energía
1,915.053
8/12/24
1.47
2,010.373
-4.74
1,633.063
377.310
23.10
-3.93
L
Grenergy Renovables
5,970.461
8/12/24
1.32
5,970.461
4,601.355
1,369.106
29.75
40.54
L
Enphase Energy
17,629.389
8/12/24
1.16
15,714.732
12.18
17,761.875
-2,047.143
-11.53
-10.37
S
SolarEdge
3,464.156
8/12/24
1.13
3,872.940
-10.55
9,362.232
-5,489.292
-58.63
-68.81
L
United Renewable
56.032
8/12/24
0.89
65.701
-14.72
58.731
6.971
11.87
0.95
L
Sino-American Sili
932.217
8/12/24
0.80
1,100.809
-15.32
932.497
168.312
18.05
29.56
Xinyi Solar
73.034
8/12/24
0.28
81.310
-10.18
111.080
-29.770
-26.80
-19.33
S
Shoals Technologies
828.877
8/12/24
0.20
987.220
-16.04
1,361.978
-374.758
-27.52
-50.36
BCPG
24.429
8/09/24
27.511
-11.20
28.500
-0.989
-3.47
-19.06
Encavis
2,946.236
8/12/24
2,928.905
0.59
2,829.415
99.490
3.52
28.59
L
GCL Poly Energy
23.586
8/12/24
24.000
-1.72
23.732
0.268
1.13
0.10
L
Neoen
6,651.561
8/12/24
-0.10
6,471.321
2.79
4,962.771
1,508.550
30.40
46.41
ReNew Energy Global
950.058
8/12/24
-0.84
982.373
-3.29
895.504
86.868
9.70
8.72
L
Voltalia
1,764.275
8/12/24
-0.97
1,590.967
10.89
1,358.655
232.313
17.10
4.89
L
Array Tech
1,135.868
8/12/24
-0.99
1,546.268
-26.54
1,954.820
-408.553
-20.90
-34.42
S
SMA Solar
3,795.445
8/12/24
-1.26
4,589.196
-17.30
8,525.056
-3,935.860
-46.17
-51.12
West Holdings
2,142.000
8/09/24
-1.38
2,485.000
-13.80
2,770.000
-285.000
-10.29
-7.06
L
Scatec
1,280.601
8/12/24
-1.46
1,300.279
-1.51
1,053.470
246.809
23.43
31.27
L
Nextracker
6,298.172
8/12/24
-2.01
7,451.814
-15.48
6,881.654
570.160
8.29
14.28
L
Canadian Solar
2,132.783
8/12/24
-2.51
2,263.658
-5.78
2,564.824
-301.166
-11.74
-31.76
L
Sunrun
2,800.085
8/12/24
-3.13
1,763.585
58.77
1,672.440
91.145
5.45
-10.32
L
Enlight Renewable
259,236.272
8/12/24
-3.23
240,974.737
7.58
251,260.554
-10,285.817
-4.09
-3.47
⇓ freshest
Δday
7/01/24
⇓ 4/29/24
prc diff
⇓
⇓
L
JinkoSolar
3,045.678
8/12/24
-3.48
3,323.587
-8.36
3,861.277
-537.691
-13.93
-24.79
S
Flat Glass
241.654
8/12/24
-3.63
237.929
1.57
386.886
-148.957
-38.50
-24.06
L
Sunnova Energy
1,069.623
8/12/24
-4.47
845.034
26.58
677.089
167.946
24.80
-30.74
Daqo New Energy
2,594.886
8/12/24
-4.74
2,312.130
12.23
3,362.041
-1,049.911
-31.23
-38.91
L
SunPower
32.315
8/12/24
-4.76
437.867
-92.62
336.984
100.883
29.94
-27.21
Altus Power
475.029
8/12/24
-6.96
602.673
-21.18
575.681
26.991
4.69
-23.18
PPVX - 30 out of 30 instruments rated - 7/01/24 / 4/29/24 - 16 did rise, Market-Ratio(9) in JPY = 53.33 %
Technical Chart
Transactions Photon Photovoltaik-Aktienindex in Japanese yen * L9 - 45 ex 1 (1)
⇐ L/S date buy date sell days instrument spl pieces prc buy prc sell prc diff d % asset yield
1/02/06 1/23/06 21 - cash -
long
1/23/06
2/06/06
14
Encavis
100
44
224.416
225.272
0.857
0
10,038
10
2/06/06
3/20/06
42
Enlight Renewable
100
0
38,221.512
34,866.977
-3,354.535
-9
10,038
0
3/20/06
4/03/06
14
Encavis
100
42
233.552
235.916
2.364
1
10,137
30
4/03/06 4/17/06 14 - cash -
4/17/06
5/01/06
14
Encavis
100
37
271.018
271.094
0.075
0
10,140
1
5/01/06 5/08/06 7 - cash -
5/08/06
6/12/06
35
Encavis
100
37
270.170
271.678
1.509
1
10,196
6
6/12/06 6/19/06 7 - cash -
6/19/06
6/26/06
7
Encavis
100
37
274.658
222.415
-52.244
-19
8,263
-100
6/26/06 10/30/06 126 - cash -
10/30/06
11/13/06
14
Encavis
100
28
285.595
289.242
3.647
1
8,365
39
11/13/06 11/20/06 7 - cash -
11/20/06
11/27/06
7
Encavis
100
28
289.261
290.640
1.379
0
8,403
28
11/27/06 12/11/06 14 - cash -
12/11/06
12/18/06
7
SunPower
100
1
4,522.601
4,381.847
-140.754
-3
8,263
-81
12/18/06
1/08/07
21
Encavis
100
27
296.002
288.003
-7.998
-3
8,047
-38
1/08/07
2/19/07
42
SunPower
100
1
4,480.812
5,373.763
892.951
20
8,940
385
2/19/07
3/19/07
28
Encavis
100
23
384.381
362.657
-21.724
-6
8,440
-53
3/19/07 3/26/07 7 - cash -
3/26/07
4/02/07
7
Encavis
100
23
366.205
356.555
-9.650
-3
8,218
-75
4/02/07
4/23/07
21
SunPower
100
1
5,515.203
6,741.186
1,225.983
22
9,444
3,175
4/23/07 5/07/07 14 - cash -
5/07/07
5/14/07
7
SunPower
100
1
6,754.172
6,806.906
52.734
1
9,497
50
5/14/07 5/21/07 7 - cash -
5/21/07
6/11/07
21
Voltalia
100
0
9,532.272
9,592.922
60.650
1
9,497
0
6/11/07 6/18/07 7 - cash -
6/18/07
7/02/07
14
SunPower
100
1
7,205.027
8,023.077
818.051
11
10,315
1,551
7/02/07 7/09/07 7 - cash -
7/09/07
7/30/07
21
SunPower
100
1
8,377.365
8,579.466
202.101
2
10,517
51
7/30/07 8/20/07 21 - cash -
8/20/07
8/27/07
7
SunPower
100
1
7,495.320
7,279.501
-215.819
-3
10,301
-78
8/27/07 9/03/07 7 - cash -
9/03/07
9/17/07
14
SunPower
100
1
8,312.152
8,613.208
301.056
4
10,602
153
9/17/07 10/01/07 14 - cash -
10/01/07
11/12/07
42
SunPower
100
1
10,092.366
12,161.810
2,069.445
21
12,671
406
11/12/07
1/14/08
63
First Solar
100
0
23,534.453
19,143.628
-4,390.826
-19
12,671
0
1/14/08 3/31/08 77 - cash -
3/31/08
5/12/08
42
First Solar
100
0
27,588.795
32,000.272
4,411.477
16
12,671
0
5/12/08
6/09/08
28
Canadian Solar
100
3
3,507.133
3,903.194
396.062
11
13,860
303
6/09/08 12/29/08 203 - cash -
12/29/08
2/09/09
42
Encavis
100
56
246.500
231.299
-15.200
-6
13,008
-42
L/S date buy date sell days instrument spl pieces prc buy prc sell prc diff d % asset yield
2/09/09
2/23/09
14
Enlight Renewable
100
3
3,406.929
2,987.767
-419.162
-12
11,751
-97
2/23/09 3/23/09 28 - cash -
3/23/09
3/30/09
7
Encavis
100
48
240.664
247.875
7.211
3
12,097
366
3/30/09
4/06/09
7
West Holdings
100
20,620
0.587
0.597
0.010
2
12,303
141
4/06/09
8/03/09
119
GCL Poly Energy
100
940
13.080
41.539
28.459
218
39,055
3,362
8/03/09 8/10/09 7 - cash -
8/10/09
8/17/09
7
West Holdings
100
16,572
2.357
2.600
0.243
10
43,087
16,695
8/17/09 8/24/09 7 - cash -
8/24/09
8/31/09
7
West Holdings
100
12,024
3.583
3.407
-0.177
-5
40,963
-93
8/31/09 9/07/09 7 - cash -
9/07/09
1/25/10
140
West Holdings
100
11,816
3.467
3.947
0.480
14
46,635
40
1/25/10 3/29/10 63 - cash -
3/29/10
4/19/10
21
West Holdings
100
10,401
4.483
3.783
-0.700
-16
39,354
-95
4/19/10 7/12/10 84 - cash -
7/12/10
8/09/10
28
United Renewable
100
117
335.513
324.731
-10.781
-3
38,093
-35
8/09/10
8/30/10
21
Enlight Renewable
100
5
6,809.378
7,641.689
832.311
12
42,254
642
8/30/10
9/06/10
7
United Renewable
100
112
374.998
384.920
9.922
3
43,366
290
9/06/10
11/22/10
77
Enlight Renewable
100
4
9,395.760
14,459.931
5,064.171
54
63,622
672
11/22/10 11/29/10 7 - cash -
11/29/10
12/06/10
7
Enlight Renewable
100
4
15,117.728
14,333.244
-784.484
-5
60,484
-94
12/06/10 1/24/11 49 - cash -
1/24/11
1/31/11
7
Enlight Renewable
100
4
13,736.514
12,192.188
-1,544.326
-11
54,307
-100
1/31/11
4/18/11
77
GCL Poly Energy
100
1,415
38.363
51.946
13.584
35
73,528
321
4/18/11 5/02/11 14 - cash -
5/02/11
5/23/11
21
GCL Poly Energy
100
1,291
56.914
42.106
-14.809
-26
54,410
-99
5/23/11 1/23/12 245 - cash -
1/23/12
3/12/12
49
Encavis
100
173
313.514
339.874
26.359
8
58,970
82
3/12/12
3/19/12
7
West Holdings
100
11,998
4.915
4.465
-0.450
-9
53,571
-99
3/19/12
3/26/12
7
Encavis
100
153
348.258
334.366
-13.892
-4
51,446
-88
3/26/12 9/17/12 175 - cash -
9/17/12
10/29/12
42
West Holdings
100
7,466
6.890
5.140
-1.750
-25
38,380
-92
10/29/12 11/05/12 7 - cash -
11/05/12
11/12/12
7
Encavis
100
112
342.410
340.336
-2.074
-1
38,148
-27
11/12/12 11/26/12 14 - cash -
11/26/12
12/17/12
21
First Solar
100
17
2,223.929
2,675.736
451.807
20
45,829
2,389
12/17/12
12/24/12
7
JinkoSolar
100
88
517.938
467.508
-50.430
-10
41,391
-100
12/24/12
1/07/13
14
First Solar
100
16
2,528.755
2,734.364
205.609
8
44,680
668
1/07/13
1/21/13
14
JinkoSolar
100
76
586.187
696.280
110.093
19
53,048
8,788
L/S date buy date sell days instrument spl pieces prc buy prc sell prc diff d % asset yield
1/21/13
1/28/13
7
Daqo New Energy
100
230
230.592
224.852
-5.740
-2
51,727
-73
1/28/13
2/04/13
7
Enlight Renewable
100
4
11,966.568
11,100.157
-866.411
-7
48,262
-98
2/04/13
2/18/13
14
Daqo New Energy
100
224
215.350
253.581
38.232
18
56,826
6,986
2/18/13
3/18/13
28
SunPower
100
45
1,252.012
1,115.656
-136.356
-11
50,690
-78
3/18/13 5/20/13 63 - cash -
5/20/13
7/01/13
42
SunPower
100
21
2,342.844
2,121.577
-221.266
-9
46,043
-58
7/01/13
7/08/13
7
Canadian Solar
100
39
1,169.842
1,245.584
75.742
6
48,997
2,534
7/08/13
8/05/13
28
SunPower
100
20
2,409.208
2,369.876
-39.333
-2
48,210
-19
8/05/13
9/30/13
56
Canadian Solar
100
31
1,517.915
1,655.992
138.077
9
52,491
76
9/30/13
10/07/13
7
Daqo New Energy
100
101
515.804
459.991
-55.813
-11
46,854
-100
10/07/13
10/21/13
14
Canadian Solar
100
25
1,850.994
2,269.769
418.774
23
57,323
20,285
10/21/13
10/28/13
7
Daqo New Energy
100
76
745.332
587.447
-157.886
-21
45,324
-100
10/28/13
11/18/13
21
Canadian Solar
100
20
2,231.008
3,099.197
868.188
39
62,687
30,176
11/18/13
11/25/13
7
Daqo New Energy
100
68
914.963
791.429
-123.534
-14
54,287
-100
11/25/13
12/16/13
21
Canadian Solar
100
18
2,930.278
3,001.273
70.995
2
55,565
52
12/16/13 1/13/14 28 - cash -
1/13/14
3/10/14
56
Canadian Solar
100
15
3,686.468
3,722.835
36.367
1
56,111
7
3/10/14
3/24/14
14
Daqo New Energy
100
52
1,066.235
738.362
-327.873
-31
39,061
-100
3/24/14 3/31/14 7 - cash -
3/31/14
4/28/14
28
Daqo New Energy
100
44
884.202
847.040
-37.162
-4
37,426
-43
4/28/14 6/02/14 35 - cash -
6/02/14
6/09/14
7
Solaria Energía
100
213
175.416
174.231
-1.185
-1
37,174
-30
6/09/14 6/16/14 7 - cash -
6/16/14
6/23/14
7
Voltalia
100
35
1,039.380
1,042.539
3.158
0
37,284
17
6/23/14 6/30/14 7 - cash -
6/30/14
7/14/14
14
Daqo New Energy
100
57
648.438
584.018
-64.420
-10
33,612
-93
7/14/14
7/21/14
7
Voltalia
100
30
1,085.381
1,044.105
-41.276
-4
32,374
-87
7/21/14
7/28/14
7
Enphase Energy
100
28
1,152.003
1,075.746
-76.256
-7
30,239
-97
7/28/14
8/04/14
7
Voltalia
100
26
1,151.724
1,145.152
-6.572
-1
30,068
-26
8/04/14 8/11/14 7 - cash -
8/11/14
8/18/14
7
Enphase Energy
100
25
1,197.806
1,352.839
155.033
13
33,944
56,949
8/18/14 9/01/14 14 - cash -
9/01/14
10/13/14
42
Enphase Energy
100
22
1,514.021
1,084.627
-429.394
-28
24,497
-94
L/S date buy date sell days instrument spl pieces prc buy prc sell prc diff d % asset yield
10/13/14
10/20/14
7
Voltalia
100
22
1,076.144
1,055.038
-21.107
-2
24,033
-64
10/20/14 2/09/15 112 - cash -
2/09/15
3/16/15
35
Enphase Energy
100
14
1,715.526
1,588.831
-126.695
-7
22,259
-55
3/16/15
5/25/15
70
Encavis
100
28
770.033
900.855
130.822
17
25,922
127
5/25/15 7/20/15 56 - cash -
7/20/15
7/27/15
7
SMA Solar
100
6
4,045.836
4,085.436
39.601
1
26,160
66
7/27/15 10/26/15 91 - cash -
10/26/15
1/11/16
77
SMA Solar
100
4
5,744.777
6,306.698
561.921
10
28,407
56
1/11/16 1/25/16 14 - cash -
1/25/16
2/01/16
7
SMA Solar
100
4
6,150.340
6,193.143
42.803
1
28,579
44
2/01/16 3/14/16 42 - cash -
3/14/16
3/28/16
14
SMA Solar
100
5
5,496.878
5,229.448
-267.429
-5
27,241
-73
3/28/16 4/11/16 14 - cash -
4/11/16
5/09/16
28
SMA Solar
100
4
5,562.131
5,733.125
170.993
3
27,925
48
5/09/16 6/06/16 28 - cash -
6/06/16
6/13/16
7
SMA Solar
100
4
6,044.940
5,298.987
-745.953
-12
24,942
-100
6/13/16 8/15/16 63 - cash -
8/15/16
8/22/16
7
Daqo New Energy
100
52
475.860
496.927
21.067
4
26,037
857
8/22/16 8/29/16 7 - cash -
8/29/16
9/12/16
14
Daqo New Energy
100
51
503.584
518.199
14.615
3
26,782
111
9/12/16 10/17/16 35 - cash -
10/17/16
10/31/16
14
Solaria Energía
100
291
91.991
95.030
3.039
3
27,667
133
10/31/16 1/09/17 70 - cash -
1/09/17
1/16/17
7
Solaria Energía
100
265
104.082
99.238
-4.844
-5
26,383
-92
1/16/17
1/23/17
7
Enlight Renewable
100
0
32,283.284
32,036.720
-246.564
-1
26,383
0
1/23/17
3/06/17
42
Solaria Energía
100
221
118.884
128.983
10.100
8
28,615
103
3/06/17
4/17/17
42
Enlight Renewable
100
0
38,054.103
37,133.763
-920.340
-2
28,615
0
4/17/17 5/15/17 28 - cash -
5/15/17
5/22/17
7
Enlight Renewable
100
0
43,414.890
42,684.303
-730.587
-2
28,615
0
5/22/17 5/29/17 7 - cash -
5/29/17
6/12/17
14
Solaria Energía
100
182
156.923
170.848
13.925
9
31,149
818
6/12/17 6/19/17 7 - cash -
6/19/17
7/24/17
35
Solaria Energía
100
197
157.983
192.729
34.746
22
37,994
695
7/24/17
8/07/17
14
JinkoSolar
100
12
3,110.930
3,212.797
101.867
3
39,217
132
8/07/17
9/11/17
35
SolarEdge
100
12
3,138.621
2,718.343
-420.278
-13
34,173
-78
9/11/17
9/18/17
7
JinkoSolar
100
10
3,139.495
3,082.379
-57.116
-2
33,602
-62
9/18/17
10/09/17
21
SolarEdge
100
11
2,988.703
3,241.083
252.380
8
36,378
309
10/09/17 10/16/17 7 - cash -
10/16/17
10/30/17
14
Sino-American Sili
100
119
303.609
312.685
9.076
3
37,458
116
10/30/17
11/20/17
21
SolarEdge
100
10
3,684.250
4,381.309
697.059
19
44,429
1,932
L/S date buy date sell days instrument spl pieces prc buy prc sell prc diff d % asset yield
11/20/17
12/25/17
35
Enphase Energy
100
154
288.333
274.012
-14.321
-5
42,224
-41
12/25/17
2/05/18
42
Daqo New Energy
100
34
1,222.865
1,065.080
-157.785
-13
36,859
-70
2/05/18
2/12/18
7
Enphase Energy
100
145
253.171
288.758
35.587
14
42,019
95,051
2/12/18 2/19/18 7 - cash -
2/19/18
2/26/18
7
Enphase Energy
100
154
271.498
286.763
15.265
6
44,370
1,633
2/26/18
3/05/18
7
SolarEdge
100
8
5,446.358
5,375.004
-71.354
-1
43,799
-50
3/05/18 3/19/18 14 - cash -
3/19/18
3/26/18
7
Enphase Energy
100
87
502.876
518.493
15.617
3
45,158
393
3/26/18 4/09/18 14 - cash -
4/09/18
6/11/18
63
Enphase Energy
100
101
443.035
508.410
65.376
15
51,761
122
6/11/18
6/18/18
7
Solaria Energía
100
69
745.919
801.023
55.104
7
55,563
4,011
6/18/18 11/19/18 154 - cash -
11/19/18
11/26/18
7
West Holdings
100
4,704
11.810
12.760
0.950
8
60,032
5,550
11/26/18 12/03/18 7 - cash -
12/03/18
12/10/18
7
West Holdings
100
4,463
13.450
11.840
-1.610
-12
52,846
-100
12/10/18 12/17/18 7 - cash -
12/17/18
12/24/18
7
Grenergy Renovables
100
76
691.292
587.584
-103.708
-15
44,964
-100
12/24/18 12/31/18 7 - cash -
12/31/18
3/25/19
84
Grenergy Renovables
100
61
734.971
839.673
104.702
14
51,351
78
3/25/19
4/01/19
7
Flat Glass
100
885
58.023
56.487
-1.536
-3
49,992
-75
4/01/19
4/22/19
21
Grenergy Renovables
100
53
936.450
957.851
21.401
2
51,126
48
4/22/19
4/29/19
7
Flat Glass
100
871
58.653
53.910
-4.742
-8
46,996
-99
4/29/19
5/06/19
7
Grenergy Renovables
100
46
1,015.560
968.347
-47.214
-5
44,824
-92
5/06/19
11/11/19
189
Enphase Energy
100
29
1,523.011
2,041.874
518.863
34
59,871
76
11/11/19
11/18/19
7
Grenergy Renovables
100
39
1,528.343
1,438.087
-90.257
-6
56,351
-96
11/18/19 12/02/19 14 - cash -
12/02/19
12/16/19
14
Grenergy Renovables
100
29
1,926.138
1,691.833
-234.305
-12
49,556
-97
12/16/19
3/16/20
91
Enphase Energy
100
17
2,822.571
2,908.957
86.386
3
51,025
13
3/16/20 5/11/20 56 - cash -
5/11/20
6/22/20
42
Enphase Energy
100
7
6,412.340
4,867.213
-1,545.127
-24
40,209
-91
6/22/20
6/29/20
7
SolarEdge
100
2
16,342.980
14,767.611
-1,575.369
-10
37,058
-99
6/29/20
7/20/20
21
Flat Glass
100
325
114.023
147.504
33.481
29
47,939
8,677
7/20/20
10/12/20
84
Sunrun
100
11
4,117.891
6,716.072
2,598.181
63
76,519
738
10/12/20
10/19/20
7
Flat Glass
100
219
348.589
271.231
-77.357
-22
59,578
-100
L/S date buy date sell days instrument spl pieces prc buy prc sell prc diff d % asset yield
10/19/20
10/26/20
7
JinkoSolar
100
7
7,970.172
6,805.351
-1,164.820
-15
51,424
-100
10/26/20
11/16/20
21
Flat Glass
100
170
301.713
267.202
-34.511
-11
45,557
-88
11/16/20
11/23/20
7
Daqo New Energy
100
9
4,564.273
4,247.688
-316.586
-7
42,708
-98
11/23/20
11/30/20
7
Flat Glass
100
140
303.396
291.205
-12.191
-4
41,001
-88
11/30/20
12/07/20
7
JinkoSolar
100
5
7,197.368
6,069.669
-1,127.700
-16
35,363
-100
12/07/20
1/04/21
28
GCL Poly Energy
100
2,352
15.034
17.303
2.269
15
40,700
525
1/04/21
1/11/21
7
Flat Glass
100
87
467.174
451.360
-15.814
-3
39,324
-83
1/11/21
1/18/21
7
Daqo New Energy
100
4
7,970.630
7,463.947
-506.684
-6
37,297
-97
1/18/21
3/01/21
42
GCL Poly Energy
100
1,640
22.738
44.547
21.809
96
73,064
34,425
3/01/21 7/05/21 126 - cash -
7/05/21
9/06/21
63
GCL Poly Energy
100
2,584
28.268
27.980
-0.288
-1
72,320
-6
9/06/21 10/18/21 42 - cash -
10/18/21
11/01/21
14
Xinte Energy
100
225
320.100
323.530
3.429
1
73,092
32
11/01/21
11/29/21
28
GCL Poly Energy
100
1,383
52.821
43.465
-9.356
-18
60,152
-92
11/29/21
12/06/21
7
Enphase Energy
100
2
29,196.801
24,162.598
-5,034.203
-17
50,084
-100
12/06/21
12/13/21
7
West Holdings
100
805
62.200
63.100
0.900
1
50,808
112
12/13/21 3/14/22 91 - cash -
3/14/22
4/04/22
21
Solaria Energía
100
19
2,543.614
2,849.596
305.982
12
56,622
620
4/04/22
4/11/22
7
Enphase Energy
100
2
26,549.269
23,571.087
-2,978.182
-11
50,666
-100
4/11/22
4/25/22
14
Solaria Energía
100
16
3,129.955
2,871.642
-258.313
-8
46,533
-89
4/25/22
5/02/22
7
Encavis
100
16
2,826.495
2,692.307
-134.187
-5
44,386
-92
5/02/22 6/06/22 35 - cash -
6/06/22
6/13/22
7
JinkoSolar
100
5
8,846.307
7,830.187
-1,016.119
-11
39,305
-100
6/13/22 6/27/22 14 - cash -
6/27/22
8/01/22
35
GCL Poly Energy
100
602
65.213
56.400
-8.813
-14
34,000
-78
8/01/22
9/26/22
56
Enphase Energy
100
0
36,998.083
39,731.327
2,733.245
7
34,000
0
9/26/22
10/03/22
7
First Solar
100
1
18,528.857
19,751.467
1,222.610
7
35,223
2,699
10/03/22 12/05/22 63 - cash -
12/05/22
1/02/23
28
First Solar
100
1
22,840.207
19,577.928
-3,262.279
-14
31,960
-87
1/02/23 1/16/23 14 - cash -
1/16/23
2/06/23
21
First Solar
100
1
23,179.613
22,226.602
-953.011
-4
31,007
-52
2/06/23 2/13/23 7 - cash -
2/13/23
3/13/23
28
First Solar
100
1
22,152.584
27,097.632
4,945.049
22
35,952
1,283
L/S date buy date sell days instrument spl pieces prc buy prc sell prc diff d % asset yield
3/13/23 5/22/23 70 - cash -
5/22/23
6/05/23
14
SMA Solar
100
2
15,063.844
13,948.126
-1,115.718
-7
33,721
-87
6/05/23 6/12/23 7 - cash -
6/12/23
6/19/23
7
First Solar
100
1
27,407.890
26,817.110
-590.780
-2
33,130
-68
6/19/23
6/26/23
7
SMA Solar
100
2
13,526.524
16,058.470
2,531.946
19
38,194
768,286
6/26/23 7/03/23 7 - cash -
7/03/23
7/31/23
28
SMA Solar
100
2
17,023.992
13,550.674
-3,473.318
-20
31,247
-95
7/31/23
8/07/23
7
First Solar
100
1
29,456.573
27,870.888
-1,585.686
-5
29,662
-94
8/07/23 12/04/23 119 - cash -
12/04/23
1/22/24
49
ReNew Energy Global
100
30
977.400
983.917
6.517
1
29,857
5
1/22/24 2/12/24 21 - cash -
2/12/24
2/19/24
7
Nextracker
100
3
8,743.482
9,089.866
346.384
4
30,896
658
2/19/24 4/08/24 49 - cash -
4/08/24
4/15/24
7
Sino-American Sili
100
31
994.184
990.626
-3.558
0
30,786
-17
4/15/24 5/06/24 21 - cash -
5/06/24
5/13/24
7
Encavis
100
10
2,803.813
2,857.838
54.025
2
31,326
171
5/13/24 5/27/24 14 - cash -
5/27/24
8/12/24
77
First Solar
100
0
43,369.259
35,421.968
-7,947.291
-18
31,326
0
accum 1/23/06
8/12/24 4457
days out of 7453 invested (60%)
213
31,326
10
Instrument Related Contribution
instrument L/S date buy date sell days prc buy prc sell prc diff d % total GCL Poly Energy long 4/06/09 8/03/09 119 13.08 41.54 28.46 217.58 1/31/11 4/18/11 77 38.36 51.95 13.58 35.41 5/02/11 5/23/11 21 56.91 42.11 -14.81 -26.02 12/07/20 1/04/21 28 15.03 17.30 2.27 15.09 1/18/21 3/01/21 42 22.74 44.55 21.81 95.91 7/05/21 9/06/21 63 28.27 27.98 -0.29 -1.02 11/01/21 11/29/21 28 52.82 43.47 -9.36 -17.71 6/27/22 8/01/22 35 65.21 56.40 -8.81 -13.51 405.32 Canadian Solar 5/12/08 6/09/08 28 3,507.13 3,903.19 396.06 11.29 7/01/13 7/08/13 7 1,169.84 1,245.58 75.74 6.47 8/05/13 9/30/13 56 1,517.92 1,655.99 138.08 9.10 10/07/13 10/21/13 14 1,850.99 2,269.77 418.77 22.62 10/28/13 11/18/13 21 2,231.01 3,099.20 868.19 38.91 11/25/13 12/16/13 21 2,930.28 3,001.27 71.00 2.42 1/13/14 3/10/14 56 3,686.47 3,722.84 36.37 0.99 127.78 Sunrun 7/20/20 10/12/20 84 4,117.89 6,716.07 2,598.18 63.09 63.09 SunPower 12/11/06 12/18/06 7 4,522.60 4,381.85 -140.75 -3.11 1/08/07 2/19/07 42 4,480.81 5,373.76 892.95 19.93 4/02/07 4/23/07 21 5,515.20 6,741.19 1,225.98 22.23 5/07/07 5/14/07 7 6,754.17 6,806.91 52.73 0.78 6/18/07 7/02/07 14 7,205.03 8,023.08 818.05 11.35 7/09/07 7/30/07 21 8,377.36 8,579.47 202.10 2.41 8/20/07 8/27/07 7 7,495.32 7,279.50 -215.82 -2.88 9/03/07 9/17/07 14 8,312.15 8,613.21 301.06 3.62 10/01/07 11/12/07 42 10,092.37 12,161.81 2,069.44 20.51 2/18/13 3/18/13 28 1,252.01 1,115.66 -136.36 -10.89 5/20/13 7/01/13 42 2,342.84 2,121.58 -221.27 -9.44 7/08/13 8/05/13 28 2,409.21 2,369.88 -39.33 -1.63 57.13 instrument L/S date buy date sell days prc buy prc sell prc diff d % total Solaria Energía 6/02/14 6/09/14 7 175.42 174.23 -1.18 -0.68 10/17/16 10/31/16 14 91.99 95.03 3.04 3.30 1/09/17 1/16/17 7 104.08 99.24 -4.84 -4.65 1/23/17 3/06/17 42 118.88 128.98 10.10 8.50 5/29/17 6/12/17 14 156.92 170.85 13.92 8.87 6/19/17 7/24/17 35 157.98 192.73 34.75 21.99 6/11/18 6/18/18 7 745.92 801.02 55.10 7.39 3/14/22 4/04/22 21 2,543.61 2,849.60 305.98 12.03 4/11/22 4/25/22 14 3,129.96 2,871.64 -258.31 -8.25 55.60 Nextracker 2/12/24 2/19/24 7 8,743.48 9,089.87 346.38 3.96 3.96 Enlight Renewable 2/06/06 3/20/06 42 38,221.51 34,866.98 -3,354.54 -8.78 2/09/09 2/23/09 14 3,406.93 2,987.77 -419.16 -12.30 8/09/10 8/30/10 21 6,809.38 7,641.69 832.31 12.22 9/06/10 11/22/10 77 9,395.76 14,459.93 5,064.17 53.90 11/29/10 12/06/10 7 15,117.73 14,333.24 -784.48 -5.19 1/24/11 1/31/11 7 13,736.51 12,192.19 -1,544.33 -11.24 1/28/13 2/04/13 7 11,966.57 11,100.16 -866.41 -7.24 1/16/17 1/23/17 7 32,283.28 32,036.72 -246.56 -0.76 3/06/17 4/17/17 42 38,054.10 37,133.76 -920.34 -2.42 5/15/17 5/22/17 7 43,414.89 42,684.30 -730.59 -1.68 2.68 Sino-American Sili 10/16/17 10/30/17 14 303.61 312.69 9.08 2.99 4/08/24 4/15/24 7 994.18 990.63 -3.56 -0.36 2.62 Xinte Energy 10/18/21 11/01/21 14 320.10 323.53 3.43 1.07 1.07 ReNew Energy Global 12/04/23 1/22/24 49 977.40 983.92 6.52 0.67 0.67 SolarEdge 8/07/17 9/11/17 35 3,138.62 2,718.34 -420.28 -13.39 9/18/17 10/09/17 21 2,988.70 3,241.08 252.38 8.44 10/30/17 11/20/17 21 3,684.25 4,381.31 697.06 18.92 2/26/18 3/05/18 7 5,446.36 5,375.00 -71.35 -1.31 6/22/20 6/29/20 7 16,342.98 14,767.61 -1,575.37 -9.64 -0.40 instrument L/S date buy date sell days prc buy prc sell prc diff d % total First Solar 11/12/07 1/14/08 63 23,534.45 19,143.63 -4,390.83 -18.66 3/31/08 5/12/08 42 27,588.79 32,000.27 4,411.48 15.99 11/26/12 12/17/12 21 2,223.93 2,675.74 451.81 20.32 12/24/12 1/07/13 14 2,528.75 2,734.36 205.61 8.13 9/26/22 10/03/22 7 18,528.86 19,751.47 1,222.61 6.60 12/05/22 1/02/23 28 22,840.21 19,577.93 -3,262.28 -14.28 1/16/23 2/06/23 21 23,179.61 22,226.60 -953.01 -4.11 2/13/23 3/13/23 28 22,152.58 27,097.63 4,945.05 22.32 6/12/23 6/19/23 7 27,407.89 26,817.11 -590.78 -2.16 7/31/23 8/07/23 7 29,456.57 27,870.89 -1,585.69 -5.38 5/27/24 8/12/24 77 43,369.26 35,421.97 -7,947.29 -18.32 -0.53 United Renewable 7/12/10 8/09/10 28 335.51 324.73 -10.78 -3.21 8/30/10 9/06/10 7 375.00 384.92 9.92 2.65 -0.65 Voltalia 5/21/07 6/11/07 21 9,532.27 9,592.92 60.65 0.64 6/16/14 6/23/14 7 1,039.38 1,042.54 3.16 0.30 7/14/14 7/21/14 7 1,085.38 1,044.10 -41.28 -3.80 7/28/14 8/04/14 7 1,151.72 1,145.15 -6.57 -0.57 10/13/14 10/20/14 7 1,076.14 1,055.04 -21.11 -1.96 -5.34 Encavis 1/23/06 2/06/06 14 224.42 225.27 0.86 0.38 3/20/06 4/03/06 14 233.55 235.92 2.36 1.01 4/17/06 5/01/06 14 271.02 271.09 0.08 0.03 5/08/06 6/12/06 35 270.17 271.68 1.51 0.56 6/19/06 6/26/06 7 274.66 222.41 -52.24 -19.02 10/30/06 11/13/06 14 285.60 289.24 3.65 1.28 11/20/06 11/27/06 7 289.26 290.64 1.38 0.48 12/18/06 1/08/07 21 296.00 288.00 -8.00 -2.70 2/19/07 3/19/07 28 384.38 362.66 -21.72 -5.65 3/26/07 4/02/07 7 366.20 356.56 -9.65 -2.64 12/29/08 2/09/09 42 246.50 231.30 -15.20 -6.17 3/23/09 3/30/09 7 240.66 247.88 7.21 3.00 1/23/12 3/12/12 49 313.51 339.87 26.36 8.41 3/19/12 3/26/12 7 348.26 334.37 -13.89 -3.99 11/05/12 11/12/12 7 342.41 340.34 -2.07 -0.61 3/16/15 5/25/15 70 770.03 900.86 130.82 16.99 4/25/22 5/02/22 7 2,826.49 2,692.31 -134.19 -4.75 5/06/24 5/13/24 7 2,803.81 2,857.84 54.02 1.93 -14.69 instrument L/S date buy date sell days prc buy prc sell prc diff d % total SMA Solar 7/20/15 7/27/15 7 4,045.84 4,085.44 39.60 0.98 10/26/15 1/11/16 77 5,744.78 6,306.70 561.92 9.78 1/25/16 2/01/16 7 6,150.34 6,193.14 42.80 0.70 3/14/16 3/28/16 14 5,496.88 5,229.45 -267.43 -4.87 4/11/16 5/09/16 28 5,562.13 5,733.12 170.99 3.07 6/06/16 6/13/16 7 6,044.94 5,298.99 -745.95 -12.34 5/22/23 6/05/23 14 15,063.84 13,948.13 -1,115.72 -7.41 6/19/23 6/26/23 7 13,526.52 16,058.47 2,531.95 18.72 7/03/23 7/31/23 28 17,023.99 13,550.67 -3,473.32 -20.40 -16.04 Enphase Energy 7/21/14 7/28/14 7 1,152.00 1,075.75 -76.26 -6.62 8/11/14 8/18/14 7 1,197.81 1,352.84 155.03 12.94 9/01/14 10/13/14 42 1,514.02 1,084.63 -429.39 -28.36 2/09/15 3/16/15 35 1,715.53 1,588.83 -126.69 -7.39 11/20/17 12/25/17 35 288.33 274.01 -14.32 -4.97 2/05/18 2/12/18 7 253.17 288.76 35.59 14.06 2/19/18 2/26/18 7 271.50 286.76 15.27 5.62 3/19/18 3/26/18 7 502.88 518.49 15.62 3.11 4/09/18 6/11/18 63 443.03 508.41 65.38 14.76 5/06/19 11/11/19 189 1,523.01 2,041.87 518.86 34.07 12/16/19 3/16/20 91 2,822.57 2,908.96 86.39 3.06 5/11/20 6/22/20 42 6,412.34 4,867.21 -1,545.13 -24.10 11/29/21 12/06/21 7 29,196.80 24,162.60 -5,034.20 -17.24 4/04/22 4/11/22 7 26,549.27 23,571.09 -2,978.18 -11.22 8/01/22 9/26/22 56 36,998.08 39,731.33 2,733.24 7.39 -21.56 Grenergy Renovables 12/17/18 12/24/18 7 691.29 587.58 -103.71 -15.00 12/31/18 3/25/19 84 734.97 839.67 104.70 14.25 4/01/19 4/22/19 21 936.45 957.85 21.40 2.29 4/29/19 5/06/19 7 1,015.56 968.35 -47.21 -4.65 11/11/19 11/18/19 7 1,528.34 1,438.09 -90.26 -5.91 12/02/19 12/16/19 14 1,926.14 1,691.83 -234.31 -12.16 -21.73 instrument L/S date buy date sell days prc buy prc sell prc diff d % total Flat Glass 3/25/19 4/01/19 7 58.02 56.49 -1.54 -2.65 4/22/19 4/29/19 7 58.65 53.91 -4.74 -8.09 6/29/20 7/20/20 21 114.02 147.50 33.48 29.36 10/12/20 10/19/20 7 348.59 271.23 -77.36 -22.19 10/26/20 11/16/20 21 301.71 267.20 -34.51 -11.44 11/23/20 11/30/20 7 303.40 291.20 -12.19 -4.02 1/04/21 1/11/21 7 467.17 451.36 -15.81 -3.39 -26.03 JinkoSolar 12/17/12 12/24/12 7 517.94 467.51 -50.43 -9.74 1/07/13 1/21/13 14 586.19 696.28 110.09 18.78 7/24/17 8/07/17 14 3,110.93 3,212.80 101.87 3.27 9/11/17 9/18/17 7 3,139.49 3,082.38 -57.12 -1.82 10/19/20 10/26/20 7 7,970.17 6,805.35 -1,164.82 -14.61 11/30/20 12/07/20 7 7,197.37 6,069.67 -1,127.70 -15.67 6/06/22 6/13/22 7 8,846.31 7,830.19 -1,016.12 -11.49 -30.71 West Holdings 3/30/09 4/06/09 7 0.59 0.60 0.01 1.70 8/10/09 8/17/09 7 2.36 2.60 0.24 10.33 8/24/09 8/31/09 7 3.58 3.41 -0.18 -4.93 9/07/09 1/25/10 140 3.47 3.95 0.48 13.85 3/29/10 4/19/10 21 4.48 3.78 -0.70 -15.61 3/12/12 3/19/12 7 4.92 4.47 -0.45 -9.16 9/17/12 10/29/12 42 6.89 5.14 -1.75 -25.40 11/19/18 11/26/18 7 11.81 12.76 0.95 8.04 12/03/18 12/10/18 7 13.45 11.84 -1.61 -11.97 12/06/21 12/13/21 7 62.20 63.10 0.90 1.45 -32.99 Daqo New Energy 1/21/13 1/28/13 7 230.59 224.85 -5.74 -2.49 2/04/13 2/18/13 14 215.35 253.58 38.23 17.75 9/30/13 10/07/13 7 515.80 459.99 -55.81 -10.82 10/21/13 10/28/13 7 745.33 587.45 -157.89 -21.18 11/18/13 11/25/13 7 914.96 791.43 -123.53 -13.50 3/10/14 3/24/14 14 1,066.23 738.36 -327.87 -30.75 3/31/14 4/28/14 28 884.20 847.04 -37.16 -4.20 6/30/14 7/14/14 14 648.44 584.02 -64.42 -9.93 8/15/16 8/22/16 7 475.86 496.93 21.07 4.43 8/29/16 9/12/16 14 503.58 518.20 14.61 2.90 12/25/17 2/05/18 42 1,222.86 1,065.08 -157.78 -12.90 11/16/20 11/23/20 7 4,564.27 4,247.69 -316.59 -6.94 1/11/21 1/18/21 7 7,970.63 7,463.95 -506.68 -6.36 -65.98
Annotations
4/22/24 PPVX Voltalia replaces Meyer Burger 11/13/23 PPVX Altus Power replaces Maxeon 2/10/23 PPVX Nextracker replaces Beijing Energy 2/06/23 Enlight Renewable reverse split 10:1 (one for ten) 9/25/22 PPVX Maxeon Solar Technologies replaces Azure Power Global 10/29/21 PPVX ReNew Energy Global replaces Soltec Power 7/29/21 United Renewable reverse stock split 0.5658:1 7/23/21 PPVX Xinte Energy replaces Maxeon 6/25/21 PPVX Enlight Renewable Energy and Flat Glass Group replace Solarpack and Renesola 4/01/21 GCL Poly Energy suspended 2/05/21 PPVX Shoals Technologies Group replaces SPCG 1/25/21 PPVX Grenergy Renovables and ReneSola replace Motech Industries and Shinsung E&G 11/17/20 Daqo New Energy stock split 1:5 (five for one) 10/31/20 PPVX Soltec Power replaces REC Silicon 10/23/20 PPVX Array Technologies and REC Silicon replace 7C Solarparken and Tainergy 10/08/20 PPVX Tainergy Tech replaces Vivint Solar (acquired by Sunrun) 9/21/20 PPVX Motech Industries and Shinsung E&G replace China Shuifa Singyes and Thai Solar Energy 3/27/20 PPVX China Singyes Solar and Edisun Power Europe replace Motech and Terraform Power 12/28/19 PPVX Motech replaces SFCE 11/08/19 PPVX Neoen replaces REC Silicon 7/29/19 PPVX Sunnova replaces Shinsung E&G 2/16/19 PPVX 7C Solarparken replaces China Singyes Solar 12/10/18 PPVX SFCE and Solarapack replace Motech Industries and Green Energy Technology 10/01/18 PPVX Thai Solar Energy returns for Gintech Energy (merger with Neo Solar Power) 7/20/18 PPVX West Holdings replaces JA Solar 7/17/18 PPVX JA Solar exits due to becoming private (mergered with JASO Acquisition Holding as wholly owner) 6/25/18 Green Energy T returns replacing 8point3 6/21/18 8point3 drops out due to acquisition by Capital Dynamics 5/18/18 PPVX Enphase Energy replaces Thai Solar Energy PCL (exit due to low stock market value) 2/27/18 Capital Stage renames into Encavis (ENergy + CApital + VISion) 2/16/18 PPVX Solaria Energía replaces SFCE (market value falls below exit threshold) 12/30/17 PPVX Vivint Solar replaces TerraForm Global (acquired by Brookfield Asset Management) 8/11/17 PPVX Shinsung E&G replaces Green Energy Technology 3/14/17 PPVX Azure Power Global replaces Trina Solar 11/25/16 PPVX Thai Solar Energy replaces SolarCity (acquired by Tesla) 11/04/16 PPVX SPCG replaces SPI 10/08/16 Chorus is replaced by BCPG 8/08/16 Capital Stage acquires Chorus Clean Energy 6/03/16 PPVX complete analysis - all techniques have been refreshed using new market composition 6/02/16 Solarenergie Change Of Composition 1/01/16 Sunrun recording started 8/18/15 Solarenergie complete analysis 7/01/15 Scatec Solar monitoring started 3/14/15 Solar Energy first complete analysis
write an annotation