Wed, Apr 1st, 2026, 10:47UTC
Assessment - FTSE / Milano Italia Borsa - 11/20/23 - RS = 28
⇐
⇓ freshest
⇓ 11/20/23
⇓ 5/08/23
prc diff
Δ28
⇓
MIB 40
31,928.300
8/12/24
0.46
29,541.900
27,426.200
2,115.700
7.71
9.28
Leonardo
21.910
8/12/24
1.20
14.920
10.445
4.475
42.84
39.73
Banca MPS
5.170
8/12/24
2.17
3.072
2.164
0.908
41.96
35.57
Banco BPM
5.782
8/12/24
-0.31
5.324
3.764
1.560
41.45
33.34
BPER Banca
4.765
8/12/24
-0.27
3.541
2.640
0.901
34.13
40.13
Unicredit
34.570
8/12/24
0.38
25.210
18.980
6.230
32.82
37.65
S
Stellantis
13.980
8/12/24
-0.57
18.894
14.820
4.074
27.49
18.82
S
Tenaris
12.830
8/12/24
0.71
15.730
12.520
3.210
25.64
8.09
Ferrari
385.700
8/12/24
332.000
268.900
63.100
23.47
29.27
A2A
1.981
8/12/24
0.92
1.934
1.627
0.307
18.87
26.21
Saipem
1.993
8/12/24
0.63
1.494
1.320
0.174
13.14
12.26
S
Eni
14.456
8/12/24
1.09
15.008
13.644
1.364
10.00
8.26
Azimut
20.900
8/12/24
1.41
22.270
20.290
1.980
9.76
8.37
Banca Generali
38.080
8/12/24
0.74
33.300
30.360
2.940
9.68
4.70
STMicroel Italy
26.830
8/12/24
0.49
42.210
38.710
3.500
9.04
2.22
Mediobanca
14.030
8/12/24
0.94
10.880
10.000
0.880
8.80
4.55
Enel
6.438
8/12/24
0.44
6.490
6.119
0.371
6.06
13.20
Recordati
49.460
8/12/24
0.24
44.620
42.080
2.540
6.04
5.49
Poste Italiane
11.890
8/12/24
9.970
9.522
0.448
4.70
2.67
L
Unipol
8.975
8/12/24
0.06
5.346
5.114
0.232
4.54
8.48
Intesa Sanpaolo
3.471
8/12/24
0.54
2.563
2.463
0.099
4.04
8.54
Banca Mediolanum
10.230
8/12/24
1.29
8.254
8.104
0.150
1.85
-0.10
Generali
22.450
8/12/24
1.35
19.230
18.990
0.240
1.26
5.00
Hera
3.294
8/12/24
0.37
2.856
2.862
-0.006
-0.21
6.58
Telecom Italia
0.221
8/12/24
0.55
0.262
0.268
-0.006
-2.35
-0.82
⇓ freshest
⇓ 11/20/23
⇓ 5/08/23
prc diff
Δ28
⇓
L
Prysmian
59.060
8/12/24
0.58
36.300
37.680
-1.380
-3.66
0.11
ERG
23.280
8/12/24
25.620
26.600
-0.980
-3.68
-2.81
Terna
7.580
8/12/24
0.53
7.464
7.930
-0.466
-5.88
-0.08
S
Nexi
5.676
8/12/24
0.46
6.986
7.500
-0.514
-6.85
-2.40
Iveco
8.642
8/12/24
-0.21
7.348
7.936
-0.588
-7.41
-5.44
FinecoBank
14.435
8/12/24
0.94
12.415
13.450
-1.035
-7.70
-7.73
Pirelli
5.246
8/12/24
0.50
4.541
4.925
-0.384
-7.80
0.22
Snam
4.368
8/12/24
0.60
4.540
5.070
-0.530
-10.45
-4.15
Brunello Cucinelli
82.800
8/12/24
-1.02
77.600
87.850
-10.250
-11.67
2.00
S
Inwit
10.320
8/12/24
0.58
10.900
12.400
-1.500
-12.10
-0.64
DiaSorin
100.100
8/12/24
0.48
88.480
102.050
-13.570
-13.30
-13.04
S
Italgas
4.904
8/12/24
0.08
5.045
5.845
-0.800
-13.69
-5.94
Interpump
37.420
8/12/24
1.14
42.850
50.640
-7.790
-15.38
-8.92
L
Campari
7.980
8/12/24
0.38
10.300
12.330
-2.030
-16.46
-7.66
L
Amplifon
28.150
8/12/24
1.33
28.170
35.850
-7.680
-21.42
-4.66
S
Moncler
52.140
8/12/24
-0.50
51.620
66.760
-15.140
-22.68
-10.83
MIB - 40 out of 40 instruments rated - 11/20/23 / 5/08/23 - 22 did rise, Market-Ratio(28) = 55.00 % Stock Exchange Currency: EUR € Euro
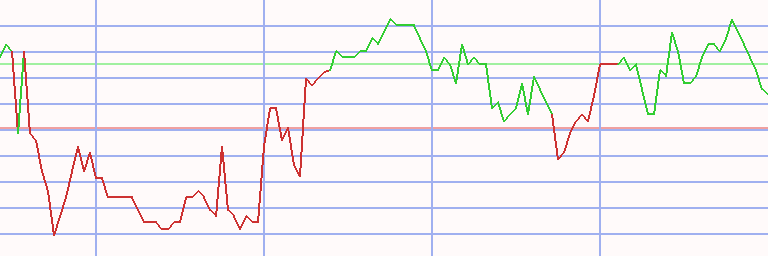
Technical Chart
Transactions FTSE / Milano Italia Borsa * A28 - 75/50 (1)
⇐ L/S date buy date sell days instrument spl pieces prc buy prc sell ps short prc diff d % asset yield
1/02/06 1/09/06 7 - cash -
long
1/09/06
9/18/06
252
Tenaris
100
978
10.224
13.792
3.568
35
13,490
54
short
9/18/06
11/27/06
70
MFE-MediaForEurope
100
320
42.025
44.660
39.390
-2.635
-6
12,646
-29
long
11/27/06
7/30/07
245
Fiat Chrysler
100
3,267
3.870
5.969
2.099
54
19,504
91
short
7/30/07
8/17/09
749
Telecom Italia
100
10,053
1.940
1.034
3.640
1.700
88
36,592
36
long
8/17/09
4/26/10
252
Banca Generali
100
5,502
6.650
8.315
1.665
25
45,753
38
short
4/26/10
12/20/10
238
Unipol
100
3,191
14.338
9.300
22.105
7.767
54
70,538
94
long
12/20/10
6/27/11
189
Exor
100
3,023
23.330
20.230
-3.100
-13
61,167
-24
short
6/27/11
11/05/12
497
UnipolSai
100
11,923
5.130
0.935
28.146
23.016
449
335,591
249
long
11/05/12
8/04/14
637
Azimut
100
36,069
9.304
18.460
9.156
98
665,839
48
short
8/04/14
1/26/15
175
YOOX Net-a-Porter
100
36,049
18.470
19.040
17.900
-0.570
-3
645,291
-6
long
1/26/15
9/21/15
238
Fiat Chrysler
100
81,004
7.966
8.487
0.520
7
687,446
10
short
9/21/15
12/26/16
462
Saipem
100
1,419
484.286
244.286
960.075
475.789
98
1,362,591
72
long
12/26/16
11/27/17
336
STMicroel Italy
100
126,752
10.750
20.210
9.460
88
2,561,665
99
short
11/27/17
1/08/18
42
Leonardo
100
250,652
10.220
10.570
9.870
-0.350
-3
2,473,936
-26
long
1/08/18
2/12/18
35
Fiat Chrysler
100
136,560
18.116
17.656
-0.460
-3
2,411,119
-24
short
2/12/18
4/29/19
441
Leonardo
100
279,064
8.640
10.415
6.865
-1.775
-21
1,915,780
-17
long
4/29/19
3/02/20
308
Azimut
100
106,580
17.975
18.590
0.615
3
1,981,327
4
short
3/02/20
9/28/20
210
Juventus Football
100
213,321
9.288
8.646
9.978
0.690
7
2,128,454
13
long
9/28/20
2/01/21
126
DiaSorin
100
12,461
170.800
180.000
9.200
5
2,243,096
16
short
2/01/21
2/08/21
7
BPER Banca
100
1,463,206
1.533
1.910
1.157
-0.377
-25
1,692,198
-100
long
2/08/21
1/24/22
350
CNH Industrial
100
142,321
11.890
13.125
1.235
10
1,867,965
11
short
1/24/22
1/31/22
7
Nexi
100
144,411
12.935
12.910
12.960
0.025
0
1,871,575
11
long
1/31/22
2/07/22
7
Unicredit
100
133,779
13.990
14.784
0.794
6
1,977,796
1,679
short
2/07/22
2/06/23
364
Saipem
100
34,425
57.452
1.368
2,412.816
2,355.364
4,100
83,061,201
4,143
long
2/06/23
10/23/23
259
Unicredit
100
4,538,367
18.302
22.690
4.388
24
103m
35
L/S date buy date sell days instrument spl pieces prc buy prc sell ps short prc diff d % asset yield short
10/23/23
1/08/24
77
CNH Industrial
100
9,760,716
10.550
11.080
10.020
-0.530
-5
97,802,376
-22
long
1/08/24
8/12/24
217
Leonardo
100
5,974,488
16.370
21.910
5.540
34
131m
63
accum 1/09/06
8/12/24 7387
days out of 7394 invested (100%)
1,308,910
131m
60
Instrument Related Contribution
instrument L/S date buy date sell days prc buy prc sell ps short prc diff d % total Saipem short 9/21/15 12/26/16 462 484.29 244.29 960.08 475.79 98.25 short 2/07/22 2/06/23 364 57.45 1.37 2,412.82 2,355.36 4,099.71 8,225.73 UnipolSai short 6/27/11 11/05/12 497 5.13 0.94 28.15 23.02 448.66 448.66 Azimut long 11/05/12 8/04/14 637 9.30 18.46 9.16 98.41 long 4/29/19 3/02/20 308 17.98 18.59 0.61 3.42 105.20 STMicroel Italy long 12/26/16 11/27/17 336 10.75 20.21 9.46 88.00 88.00 Telecom Italia short 7/30/07 8/17/09 749 1.94 1.03 3.64 1.70 87.62 87.62 Fiat Chrysler long 11/27/06 7/30/07 245 3.87 5.97 2.10 54.24 long 1/26/15 9/21/15 238 7.97 8.49 0.52 6.53 long 1/08/18 2/12/18 35 18.12 17.66 -0.46 -2.54 60.14 Unipol short 4/26/10 12/20/10 238 14.34 9.30 22.11 7.77 54.17 54.17 Tenaris long 1/09/06 9/18/06 252 10.22 13.79 3.57 34.90 34.90 Unicredit long 1/31/22 2/07/22 7 13.99 14.78 0.79 5.68 long 2/06/23 10/23/23 259 18.30 22.69 4.39 23.98 31.01 Banca Generali long 8/17/09 4/26/10 252 6.65 8.32 1.67 25.04 25.04 Juventus Football short 3/02/20 9/28/20 210 9.29 8.65 9.98 0.69 7.43 7.43 DiaSorin long 9/28/20 2/01/21 126 170.80 180.00 9.20 5.39 5.39 CNH Industrial long 2/08/21 1/24/22 350 11.89 13.13 1.24 10.39 short 10/23/23 1/08/24 77 10.55 11.08 10.02 -0.53 -5.02 4.84 Leonardo short 11/27/17 1/08/18 42 10.22 10.57 9.87 -0.35 -3.42 short 2/12/18 4/29/19 441 8.64 10.42 6.87 -1.78 -20.54 long 1/08/24 8/12/24 217 16.37 21.91 5.54 33.84 2.70 Nexi short 1/24/22 1/31/22 7 12.94 12.91 12.96 0.03 0.19 0.19 YOOX Net-a-Porter short 8/04/14 1/26/15 175 18.47 19.04 17.90 -0.57 -3.09 -3.09 MFE-MediaForEurope short 9/18/06 11/27/06 70 42.03 44.66 39.39 -2.64 -6.27 -6.27 instrument L/S date buy date sell days prc buy prc sell ps short prc diff d % total Exor long 12/20/10 6/27/11 189 23.33 20.23 -3.10 -13.29 -13.29 BPER Banca short 2/01/21 2/08/21 7 1.53 1.91 1.16 -0.38 -24.56 -24.56
Annotations
2/21/24 MIB Component update: BMPS and Brunello Cucinelli replace Buzzi Unicem and CNH Industrial 6/13/22 Saipem reverse split 10:1 (one for ten) 6/22/18 Pirelli returns 6/15/18 YOOX Net-a-P drops out due to acquisition by Richemont 5/22/17 Saipem reverse stock split 10:1 (one for ten) 5/08/17 Davide Campari stock split 1:2 (two for one) 4/17/17 MIB Machine Learning processed for all techniques. 4/12/17 MIB The market needs to be re-learned, because the BMPS price development generated biased techniques. 3/20/17 MIB Banca Generali replaces Banca Monte dei Paschi di Siena 1/23/17 Unicredit reverse stock split 10:1 (one for ten) 1/01/17 MIB result of merger of Popolare and Popolare di Milano 11/07/16 Snam spin-off Italgas 5:1 (one new Italgas for five Snam) 10/06/16 MIB Brembo replaces Italcementi (acquired by HeidelbergCement) 6/20/16 MIB Recordati replaces Anima 5/06/16 Finmeccanica got granted a really big name: Leonardo 4/05/16 MIB EGP was replaced by FinecoBank 1/25/16 Saipem ex capital increase: strike new shares EUR 0.362 - ratio 1:22 12/21/15 MIB Poste Italiane replaces Ansaldo STS 11/18/15 MIB complete analysis 11/02/15 Pirelli drops out due to acquisition by CNCC 9/21/15 Unipol re-joins the MIB as replacement for Autogrill 8/29/15 MIB complete analysis 5/18/15 Banca MPS reverse stock split 20:1 (one for twenty)
write an annotation