| | Sat, May 30th, 2026, 12:03UTC |
| | |

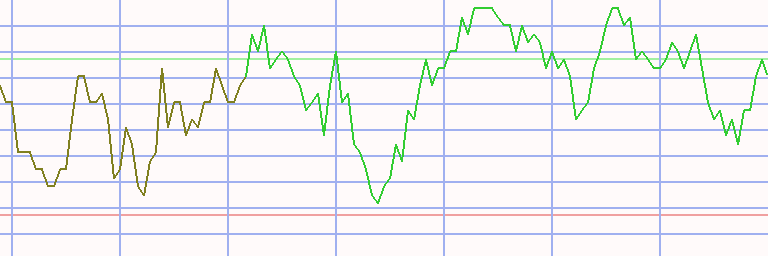
Assessment - BSE Sensex 30 in Japanese yen - 7/01/24 - RS = 18
⇐
| |
|
instrument |
freshest |
⇓ Δday |
7/01/24 |
⇓ Δwk |
2/26/24 |
prc diff |
⇓ Δ18 |
|
⇓∅-RS |
| |  |
 |
 |
|
|
 |
BSE Sensex |
154,282.639 |
8/12/24 |
-0.07 |
153,948.113 |
0.22 |
132,382.364 |
21,565.749 |
16.29 |
|
23.84 |
| | |
|
|
|
L |
|
Asian Paints |
5,914.153 |
8/12/24 |
0.41 |
5,671.249 |
4.28 |
5,216.811 |
454.438 |
8.71 |
|
2.57 |
| | |
|
|
|
L |
|
Axis Bank |
2,255.289 |
8/12/24 |
1.89 |
2,444.343 |
-7.73 |
1,973.638 |
470.705 |
23.85 |
|
30.29 |
| | |
|
|
|
L |
|
Bajaj Finance |
12,800.212 |
8/12/24 |
-0.15 |
14,095.313 |
-9.19 |
12,081.988 |
2,013.325 |
16.66 |
|
9.66 |
| | |
|
|
|
|
|
Bajaj Finserv |
3,019.836 |
8/12/24 |
-0.08 |
3,060.901 |
-1.34 |
2,935.905 |
124.996 |
4.26 |
|
7.08 |
| | |
|
|
|
L |
|
Bharti Airtel |
2,825.358 |
8/12/24 |
-0.38 |
2,816.448 |
0.32 |
2,018.833 |
797.615 |
39.51 |
|
51.85 |
| | |
|
|
|
|
|
HCL Technologies |
3,070.683 |
8/12/24 |
-0.30 |
2,845.213 |
7.92 |
3,000.469 |
-155.256 |
-5.17 |
|
17.93 |
| | |
|
|
|
L |
|
HDFC Bank |
3,215.670 |
8/12/24 |
0.60 |
3,303.031 |
-2.64 |
2,586.718 |
716.313 |
27.69 |
|
19.24 |
| | |
|
|
|
L |
|
Hindustan Unilever |
5,324.326 |
8/12/24 |
0.05 |
4,852.464 |
9.72 |
4,372.577 |
479.887 |
10.97 |
|
9.97 |
| | |
|
|
|
|
|
ICICI Bank |
2,271.754 |
8/12/24 |
0.10 |
2,347.395 |
-3.22 |
1,917.259 |
430.136 |
22.43 |
|
29.70 |
| | |
|
|
|
|
|
IndusInd Bank |
2,616.643 |
8/12/24 |
0.08 |
2,822.065 |
-7.28 |
2,667.104 |
154.961 |
5.81 |
|
6.90 |
| | |
|
|
|
|
|
Infosys |
3,481.625 |
8/12/24 |
1.51 |
3,081.434 |
12.99 |
3,019.292 |
62.142 |
2.06 |
|
16.94 |
| | |
|
|
|
|
|
ITC |
958.057 |
8/12/24 |
-0.26 |
831.084 |
15.28 |
744.206 |
86.878 |
11.67 |
|
5.35 |
| | |
|
|
|
L |
|
JSW Steel |
1,776.938 |
8/12/24 |
1.35 |
1,828.367 |
-2.81 |
1,470.863 |
357.504 |
24.31 |
|
24.85 |
| | |
|
|
|
L |
|
Kotak Mahindra Bank |
3,433.490 |
8/12/24 |
0.16 |
3,502.351 |
-1.97 |
3,103.225 |
399.127 |
12.86 |
|
10.20 |
| | |
|
|
|
|
|
Larsen & Toubro |
6,918.989 |
8/12/24 |
-0.56 |
6,831.048 |
1.29 |
6,311.115 |
519.933 |
8.24 |
|
21.12 |
| | |
|
|
|
L |
|
Mahindra & Mahindra |
5,264.181 |
8/12/24 |
-1.15 |
5,570.620 |
-5.50 |
3,509.701 |
2,060.919 |
58.72 |
|
80.35 |
| | |
|
|
|
|
|
Maruti Suzuki |
23,773.607 |
8/12/24 |
0.40 |
23,454.965 |
1.36 |
20,854.877 |
2,600.089 |
12.47 |
|
21.60 |
| | |
|
|
|
|
|
Nestlé India |
4,790.479 |
8/12/24 |
-1.26 |
4,974.497 |
-3.70 |
4,699.304 |
275.194 |
5.86 |
|
15.19 |
| | |
|
|
|
|
|
NTPC |
776.460 |
8/12/24 |
-2.39 |
716.218 |
8.41 |
613.989 |
102.230 |
16.65 |
|
46.88 |
| | |
|
|
|
L |
|
Power Grid |
660.819 |
8/12/24 |
-1.40 |
638.446 |
3.50 |
523.418 |
115.029 |
21.98 |
|
54.50 |
| | |
|
|
|
|
|
Reliance Industries |
5,658.561 |
8/12/24 |
-0.93 |
6,044.128 |
-6.38 |
5,409.955 |
634.172 |
11.72 |
|
28.11 |
| | |
|
|
|
L |
|
State Bank of India |
1,574.034 |
8/12/24 |
-1.42 |
1,630.886 |
-3.49 |
1,380.201 |
250.685 |
18.16 |
|
40.13 |
| | |
|
|
|
|
|
Sun Pharma |
3,358.527 |
8/12/24 |
-0.08 |
2,944.486 |
14.06 |
2,831.604 |
112.882 |
3.99 |
|
28.56 |
| | |
|
|
|
|
|
Tata Consultancy |
8,127.117 |
8/12/24 |
-0.78 |
7,705.909 |
5.47 |
7,276.655 |
429.254 |
5.90 |
|
17.50 |
| |
|
instrument |
freshest |
⇓ Δday |
7/01/24 |
⇓ Δwk |
2/26/24 |
prc diff |
⇓ Δ18 |
|
⇓∅-RS |
| | |
|
|
|
|
|
Tata Motors |
2,084.539 |
8/12/24 |
0.75 |
1,941.005 |
7.39 |
1,704.018 |
236.987 |
13.91 |
|
44.41 |
| | |
|
|
|
L |
|
Tata Steel |
294.545 |
8/12/24 |
0.16 |
337.180 |
-12.64 |
259.436 |
77.744 |
29.97 |
|
39.08 |
| | |
|
|
|
|
|
Tech Mahindra |
2,929.764 |
8/12/24 |
0.38 |
2,851.508 |
2.74 |
2,361.110 |
490.398 |
20.77 |
|
28.64 |
| | |
|
|
|
|
|
Titan |
6,432.600 |
8/12/24 |
-0.33 |
6,646.836 |
-3.22 |
6,588.191 |
58.644 |
0.89 |
|
10.12 |
| | |
|
|
|
L |
|
UltraTech Cement |
21,893.909 |
8/12/24 |
0.02 |
23,059.810 |
-5.06 |
18,059.647 |
5,000.164 |
27.69 |
|
40.67 |
| | |
|
|
|
|
|
Wipro |
947.307 |
8/12/24 |
-0.46 |
1,021.495 |
-7.26 |
969.178 |
52.317 |
5.40 |
|
30.09 |
| BSE Sensex 30 - 30 out of 30 instruments rated - 7/01/24 / 2/26/24 - 29 did rise, Market-Ratio(18) in JPY = 96.67 % |
| Stock Exchange Currency: INR ₹ Indian rupee |
Technical Chart
Transactions BSE Sensex 30 in Japanese yen * S18 - 16/77 (1)
Annotations
| 3/04/24 | BSE Sensex 30 | | | Component update: JSW Steel replaces HDFC |
| 1/05/24 | Nestlé India | | | stock split 1:10 (ten for one) |
| 9/18/23 | Power Grid | | | stock split 3:4 (four for three) |
| 7/28/22 | Tata Steel | | | stock split 1:10 (ten for one) |
| 7/29/21 | Power Grid | | | stock split 3:4 (four for three) |
| 12/05/19 | HCL Technologies | | | splits 1:2 (two for one) |
| 9/04/18 | Infosys | | | stock split 1:2 (teo for one) |
| 5/31/18 | Tata Consultancy | | | stock split 1:2 (two for one) |
| 12/21/17 | Mahindra & Mahindra | | | stock split 1:2 (two for one) |
| 9/07/17 | Reliance Industries | | | stock split 1:2 (two for one) |
| 7/13/17 | Larsen & Toubro | | | stock split 2:3 (three for two) |
| 6/13/17 | Wipro | | | stock split 1:2 (two for one) |
| 7/01/16 | ITC | | | stock split 2:3 (three for two) |
| 4/02/16 | BSE Sensex | | | complete analysis |
| | BSE Sensex | | | Adani Ports, Asian Paints and Lupin replace Hindalco, Tata Power and Vedanta |
|
|