| | |
| | |

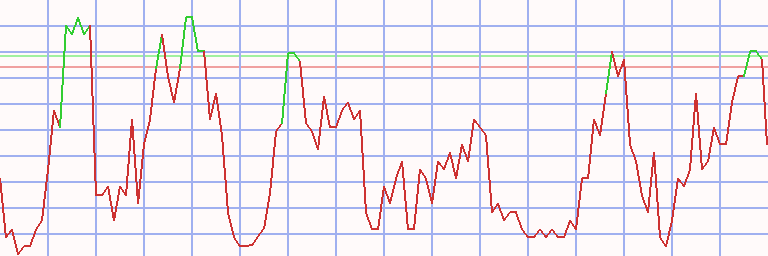
Assessment - Renixx 30 Index in Dollar - 7/01/24 - RS = 8
⇐
| |
|
instrument |
freshest |
⇓ Δday |
7/01/24 |
⇓ Δwk |
5/06/24 |
prc diff |
⇓ Δ8 |
|
⇓∅-RS |
| |  |
 |
 |
|
L |
 |
SOM Price Index |
1,705.710 |
8/12/24 |
-1.42 |
1,745.490 |
-2.28 |
1,869.250 |
-123.760 |
-6.62 |
|
-7.83 |
| | |
|
|
|
L |
|
Array Tech |
7.030 |
8/12/24 |
-0.99 |
9.570 |
-26.54 |
13.740 |
-4.170 |
-30.35 |
|
-22.33 |
| | |
|
|
|
|
|
Ballard Power |
1.827 |
8/12/24 |
-5.99 |
2.249 |
-18.77 |
2.833 |
-0.585 |
-20.64 |
|
-34.30 |
| | |
|
|
|
L |
|
Bloom Energy |
11.140 |
8/12/24 |
-3.05 |
11.370 |
-2.02 |
12.200 |
-0.830 |
-6.80 |
|
10.15 |
| | |
|
|
|
L |
|
Boralex |
25.099 |
8/12/24 |
0.09 |
24.386 |
2.92 |
21.906 |
2.479 |
11.32 |
|
6.80 |
| | |
|
|
|
L |
|
Canadian Solar |
13.200 |
8/12/24 |
-2.51 |
14.010 |
-5.78 |
17.360 |
-3.350 |
-19.30 |
|
-27.00 |
| | |
|
|
|
L |
|
China Longyuan |
0.865 |
8/12/24 |
-0.35 |
0.875 |
-1.10 |
0.724 |
0.151 |
20.78 |
|
15.25 |
| | |
|
|
|
|
|
Daqo New Energy |
16.060 |
8/12/24 |
-4.74 |
14.310 |
12.23 |
19.020 |
-4.710 |
-24.76 |
|
-26.64 |
| | |
|
|
|
L |
|
EDP Renováveis |
15.027 |
8/12/24 |
-0.92 |
14.244 |
5.50 |
14.346 |
-0.101 |
-0.71 |
|
-13.18 |
| | |
|
|
|
|
|
Encavis |
18.235 |
8/12/24 |
|
18.127 |
0.59 |
18.226 |
-0.099 |
-0.54 |
|
18.17 |
| | |
|
|
|
L |
|
Enphase Energy |
109.110 |
8/12/24 |
1.16 |
97.260 |
12.18 |
115.080 |
-17.820 |
-15.48 |
|
2.00 |
| | |
|
|
|
L |
|
First Solar |
219.230 |
8/12/24 |
3.51 |
222.710 |
-1.56 |
193.810 |
28.900 |
14.91 |
|
53.49 |
| | |
|
|
|
|
|
FuelCell Energy |
0.441 |
8/12/24 |
-1.61 |
0.611 |
-27.76 |
0.865 |
-0.255 |
-29.42 |
|
-35.70 |
| | |
|
|
|
L |
|
Goldwind Sc&Tech |
0.508 |
8/12/24 |
1.28 |
0.397 |
27.94 |
0.433 |
-0.035 |
-8.14 |
|
-13.43 |
| | |
|
|
|
|
|
Innergex RE |
6.877 |
8/12/24 |
-1.87 |
7.444 |
-7.62 |
6.384 |
1.060 |
16.60 |
|
5.22 |
| | |
|
|
|
L |
|
JinkoSolar |
18.850 |
8/12/24 |
-3.48 |
20.570 |
-8.36 |
25.710 |
-5.140 |
-19.99 |
|
-20.77 |
| | |
|
|
|
L |
|
Neoen |
41.167 |
8/12/24 |
-0.10 |
40.052 |
2.79 |
32.205 |
7.846 |
24.36 |
|
34.60 |
| | |
|
|
|
|
|
Nordex |
14.094 |
8/12/24 |
-2.81 |
12.346 |
14.16 |
14.540 |
-2.194 |
-15.09 |
|
1.69 |
| | |
|
|
|
L |
|
Northland Power |
17.028 |
8/12/24 |
-0.47 |
17.116 |
-0.51 |
15.778 |
1.338 |
8.48 |
|
-0.58 |
| | |
|
|
|
L |
|
Ormat Technologies |
71.710 |
8/12/24 |
-1.10 |
69.200 |
3.63 |
67.640 |
1.560 |
2.31 |
|
4.32 |
| | |
|
|
|
L |
|
Ørsted |
60.050 |
8/12/24 |
0.63 |
54.081 |
11.04 |
59.766 |
-5.685 |
-9.51 |
|
-5.94 |
| | |
|
|
|
L |
|
Plug Power |
1.950 |
8/12/24 |
-1.02 |
2.280 |
-14.47 |
2.710 |
-0.430 |
-15.87 |
|
-39.70 |
| | |
|
|
|
S |
|
SolarEdge |
21.440 |
8/12/24 |
1.13 |
23.970 |
-10.55 |
60.070 |
-36.100 |
-60.10 |
|
-55.38 |
| | |
|
|
|
L |
|
Sunnova Energy |
6.620 |
8/12/24 |
-4.47 |
5.230 |
26.58 |
4.670 |
0.560 |
11.99 |
|
-39.06 |
| | |
|
|
|
L |
|
SunPower |
0.200 |
8/12/24 |
-4.76 |
2.710 |
-92.62 |
2.360 |
0.350 |
14.83 |
|
-34.59 |
| |
|
instrument |
freshest |
⇓ Δday |
7/01/24 |
⇓ Δwk |
5/06/24 |
prc diff |
⇓ Δ8 |
|
⇓∅-RS |
| | |
|
|
|
L |
|
Sunrun |
17.330 |
8/12/24 |
-3.13 |
10.915 |
58.77 |
11.990 |
-1.075 |
-8.97 |
|
-4.22 |
| | |
|
|
|
|
|
Tesla Motors |
197.490 |
8/12/24 |
-1.26 |
209.860 |
-5.89 |
184.760 |
25.100 |
13.59 |
|
-12.07 |
| | |
|
|
|
L |
|
Verbio |
17.269 |
8/12/24 |
0.06 |
18.589 |
-7.10 |
21.794 |
-3.205 |
-14.71 |
|
-35.04 |
| | |
|
|
|
L |
|
Verbund |
82.431 |
8/12/24 |
1.52 |
81.251 |
1.45 |
80.944 |
0.307 |
0.38 |
|
-0.05 |
| | |
|
|
|
|
|
Vestas Wind Systems |
21.899 |
8/12/24 |
-7.76 |
23.315 |
-6.08 |
26.249 |
-2.934 |
-11.18 |
|
-9.35 |
| | |
|
|
|
|
|
Xinyi Solar |
0.452 |
8/12/24 |
0.28 |
0.503 |
-10.18 |
0.737 |
-0.234 |
-31.73 |
|
-25.66 |
| Renixx 30 - 30 out of 30 instruments rated - 7/01/24 / 5/06/24 - 11 did rise, Market-Ratio(8) in USD = 36.67 % |
Technical Chart
Transactions Renixx 30 Index in Dollar * L8 - 78/74 (2)
|
⇐ |
| |
| L/S | date buy | date sell | days | | instrument | spl | pieces | | prc buy | prc sell | | prc diff | d % | asset | yield | |
| 1/02/06 |
1/23/06 |
21 |
|
- cash - |
| long |
1/23/06 |
5/29/06 |
126 |
|
|
|
Nordex |
50 |
763 |
|
6.552 |
19.486 |
|
12.934 |
197 |
19,868 |
2,250 |
|
| |
|
|
|
|
|
|
Ormat Technologies |
50 |
141 |
|
35.230 |
37.130 |
|
1.900 |
5 |
20,136 |
16 |
|
| 100 |
102 |
663 | |
| 5/29/06 |
9/04/06 |
98 |
|
- cash - |
| |
9/04/06 |
9/18/06 |
14 |
|
|
|
Nordex |
50 |
590 |
|
17.046 |
14.840 |
|
-2.206 |
-13 |
18,835 |
-97 |
|
| |
|
|
|
|
|
|
Vestas Wind Systems |
50 |
1,743 |
|
5.782 |
5.516 |
|
-0.266 |
-5 |
18,371 |
-71 |
|
| 100 |
-9 |
-91 | |
| 9/18/06 |
11/20/06 |
63 |
|
- cash - |
| |
11/20/06 |
12/18/06 |
28 |
|
|
|
Nordex |
50 |
568 |
|
16.163 |
17.017 |
|
0.854 |
5 |
18,856 |
96 |
|
| |
|
|
|
|
|
|
Vestas Wind Systems |
50 |
1,469 |
|
6.252 |
8.300 |
|
2.048 |
33 |
21,865 |
3,920 |
|
| 100 |
19 |
868 | |
| 12/18/06 |
2/05/07 |
49 |
|
- cash - |
| |
2/05/07 |
2/12/07 |
7 |
|
|
|
Nordex |
50 |
453 |
|
24.109 |
26.330 |
|
2.221 |
9 |
22,871 |
9,796 |
|
| |
|
|
|
|
|
|
Vestas Wind Systems |
50 |
1,180 |
|
9.268 |
10.036 |
|
0.768 |
8 |
23,777 |
6,239 |
|
| 100 |
9 |
7,823 | |
| 2/12/07 |
4/30/07 |
77 |
|
- cash - |
| |
4/30/07 |
5/28/07 |
28 |
|
|
|
Nordex |
50 |
298 |
|
39.853 |
35.672 |
|
-4.181 |
-10 |
22,531 |
-76 |
|
| |
|
|
|
|
|
|
Vestas Wind Systems |
50 |
904 |
|
13.158 |
13.818 |
|
0.660 |
5 |
23,127 |
89 |
|
| 100 |
-3 |
-30 | |
| 5/28/07 |
7/02/07 |
35 |
|
- cash - |
| |
7/02/07 |
7/30/07 |
28 |
|
|
|
Nordex |
50 |
282 |
|
40.880 |
41.709 |
|
0.829 |
2 |
23,361 |
30 |
|
|