| | |
| | |

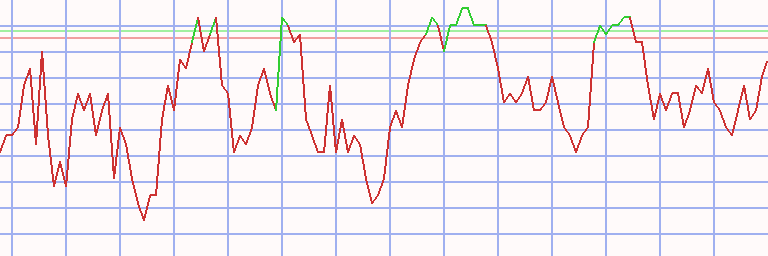
Assessment - BSE Sensex 30 in Japanese yen - 7/01/24 - RS = 9
⇐
| |
|
⇓instrument |
freshest |
Δday |
7/01/24 |
⇓ Δwk |
4/29/24 |
prc diff |
⇓ Δ9 |
|
⇓∅-RS |
| |  |
 |
 |
|
|
 |
BSE Sensex |
154,282.639 |
8/12/24 |
-0.07 |
153,948.113 |
0.22 |
139,608.041 |
14,340.072 |
10.27 |
|
23.84 |
| | |
|
|
|
L |
|
Axis Bank |
2,255.289 |
8/12/24 |
1.89 |
2,444.343 |
-7.73 |
2,167.374 |
276.970 |
12.78 |
|
30.29 |
| | |
|
|
|
|
|
Infosys |
3,481.625 |
8/12/24 |
1.51 |
3,081.434 |
12.99 |
2,682.458 |
398.976 |
14.87 |
|
16.94 |
| | |
|
|
|
L |
|
JSW Steel |
1,776.938 |
8/12/24 |
1.35 |
1,828.367 |
-2.81 |
1,674.725 |
153.641 |
9.17 |
|
24.85 |
| | |
|
|
|
|
|
Tata Motors |
2,084.539 |
8/12/24 |
0.75 |
1,941.005 |
7.39 |
1,870.756 |
70.249 |
3.76 |
|
44.41 |
| | |
|
|
|
L |
|
HDFC Bank |
3,215.670 |
8/12/24 |
0.60 |
3,303.031 |
-2.64 |
2,859.606 |
443.425 |
15.51 |
|
19.24 |
| | |
|
|
|
L |
|
Asian Paints |
5,914.153 |
8/12/24 |
0.41 |
5,671.249 |
4.28 |
5,362.486 |
308.763 |
5.76 |
|
2.57 |
| | |
|
|
|
|
|
Maruti Suzuki |
23,773.607 |
8/12/24 |
0.40 |
23,454.965 |
1.36 |
23,725.288 |
-270.323 |
-1.14 |
|
21.60 |
| | |
|
|
|
|
|
Tech Mahindra |
2,929.764 |
8/12/24 |
0.38 |
2,851.508 |
2.74 |
2,408.650 |
442.858 |
18.39 |
|
28.64 |
| | |
|
|
|
L |
|
Kotak Mahindra Bank |
3,433.490 |
8/12/24 |
0.16 |
3,502.351 |
-1.97 |
3,066.948 |
435.403 |
14.20 |
|
10.20 |
| | |
|
|
|
L |
|
Tata Steel |
294.545 |
8/12/24 |
0.16 |
337.180 |
-12.64 |
312.977 |
24.203 |
7.73 |
|
39.08 |
| | |
|
|
|
|
|
ICICI Bank |
2,271.754 |
8/12/24 |
0.10 |
2,347.395 |
-3.22 |
2,169.057 |
178.338 |
8.22 |
|
29.70 |
| | |
|
|
|
|
|
IndusInd Bank |
2,616.643 |
8/12/24 |
0.08 |
2,822.065 |
-7.28 |
2,780.614 |
41.451 |
1.49 |
|
6.90 |
| | |
|
|
|
L |
|
Hindustan Unilever |
5,324.326 |
8/12/24 |
0.05 |
4,852.464 |
9.72 |
4,161.993 |
690.471 |
16.59 |
|
9.97 |
| | |
|
|
|
L |
|
UltraTech Cement |
21,893.909 |
8/12/24 |
0.02 |
23,059.810 |
-5.06 |
18,629.880 |
4,429.931 |
23.78 |
|
40.67 |
| | |
|
|
|
|
|
Bajaj Finserv |
3,019.836 |
8/12/24 |
-0.08 |
3,060.901 |
-1.34 |
2,983.282 |
77.619 |
2.60 |
|
7.08 |
| | |
|
|
|
|
|
Sun Pharma |
3,358.527 |
8/12/24 |
-0.08 |
2,944.486 |
14.06 |
2,844.836 |
99.650 |
3.50 |
|
28.56 |
| | |
|
|
|
L |
|
Bajaj Finance |
12,800.212 |
8/12/24 |
-0.15 |
14,095.313 |
-9.19 |
12,763.247 |
1,332.066 |
10.44 |
|
9.66 |
| | |
|
|
|
|
|
ITC |
958.057 |
8/12/24 |
-0.26 |
831.084 |
15.28 |
819.274 |
11.811 |
1.44 |
|
5.35 |
| | |
|
|
|
|
|
HCL Technologies |
3,070.683 |
8/12/24 |
-0.30 |
2,845.213 |
7.92 |
2,593.931 |
251.282 |
9.69 |
|
17.93 |
| | |
|
|
|
|
|
Titan |
6,432.600 |
8/12/24 |
-0.33 |
6,646.836 |
-3.22 |
6,739.752 |
-92.916 |
-1.38 |
|
10.12 |
| | |
|
|
|
L |
|
Bharti Airtel |
2,825.358 |
8/12/24 |
-0.38 |
2,816.448 |
0.32 |
2,491.195 |
325.253 |
13.06 |
|
51.85 |
| | |
|
|
|
|
|
Wipro |
947.307 |
8/12/24 |
-0.46 |
1,021.495 |
-7.26 |
865.547 |
155.948 |
18.02 |
|
30.09 |
| | |
|
|
|
|
|
Larsen & Toubro |
6,918.989 |
8/12/24 |
-0.56 |
6,831.048 |
1.29 |
6,794.813 |
36.235 |
0.53 |
|
21.12 |
| | |
|
|
|
|
|
Tata Consultancy |
8,127.117 |
8/12/24 |
-0.78 |
7,705.909 |
5.47 |
7,235.860 |
470.050 |
6.50 |
|
17.50 |
| |
|
⇓instrument |
freshest |
Δday |
7/01/24 |
⇓ Δwk |
4/29/24 |
prc diff |
⇓ Δ9 |
|
⇓∅-RS |
| | |
|
|
|
|
|
Reliance Industries |
5,658.561 |
8/12/24 |
-0.93 |
6,044.128 |
-6.38 |
5,478.123 |
566.005 |
10.33 |
|
28.11 |
| | |
|
|
|
L |
|
Mahindra & Mahindra |
5,264.181 |
8/12/24 |
-1.15 |
5,570.620 |
-5.50 |
3,855.280 |
1,715.340 |
44.49 |
|
80.35 |
| | |
|
|
|
|
|
Nestlé India |
4,790.479 |
8/12/24 |
-1.26 |
4,974.497 |
-3.70 |
4,692.409 |
282.089 |
6.01 |
|
15.19 |
| | |
|
|
|
L |
|
Power Grid |
660.819 |
8/12/24 |
-1.40 |
638.446 |
3.50 |
549.112 |
89.335 |
16.27 |
|
54.50 |
| | |
|
|
|
L |
|
State Bank of India |
1,574.034 |
8/12/24 |
-1.42 |
1,630.886 |
-3.49 |
1,545.253 |
85.633 |
5.54 |
|
40.13 |
| | |
|
|
|
|
|
NTPC |
776.460 |
8/12/24 |
-2.39 |
716.218 |
8.41 |
678.677 |
37.541 |
5.53 |
|
46.88 |
| BSE Sensex 30 - 30 out of 30 instruments rated - 7/01/24 / 4/29/24 - 28 did rise, Market-Ratio(9) in JPY = 93.33 % |
| Stock Exchange Currency: INR ₹ Indian rupee |
Technical Chart
Transactions BSE Sensex 30 in Japanese yen * L9 - 88/85 (1)
|
⇐ |
| |
| L/S | date buy | date sell | days | | instrument | spl | pieces | | prc buy | prc sell | | prc diff | d % | asset | yield | |
| 1/02/06 |
1/23/06 |
21 |
|
- cash - |
| long |
1/23/06 |
2/06/06 |
14 |
|
|
|
Lupin |
100 |
491 |
|
20.340 |
23.716 |
|
3.376 |
17 |
11,657 |
5,377 |
|
| 2/06/06 |
3/13/06 |
35 |
|
- cash - |
| |
3/13/06 |
5/08/06 |
56 |
|
|
|
Bharat Heavy |
100 |
310 |
|
37.575 |
39.013 |
|
1.437 |
4 |
12,103 |
28 |
|
| 5/08/06 |
8/14/06 |
98 |
|
- cash - |
| |
8/14/06 |
10/23/06 |
70 |
|
|
|
Bharat Heavy |
100 |
317 |
|
38.081 |
43.352 |
|
5.271 |
14 |
13,774 |
97 |
|
| 10/23/06 |
10/22/07 |
364 |
|
- cash - |
| |
10/22/07 |
11/05/07 |
14 |
|
|
|
Larsen & Toubro |
100 |
55 |
|
247.958 |
266.861 |
|
18.903 |
8 |
14,814 |
579 |
|
| 11/05/07 |
4/06/09 |
518 |
|
- cash - |
| |
4/06/09 |
7/20/09 |
105 |
|
|
|
Maruti Suzuki |
100 |
92 |
|
159.806 |
266.824 |
|
107.018 |
67 |
24,659 |
494 |
|
| 7/20/09 |
9/07/09 |
49 |
|
- cash - |
| |
9/07/09 |
9/21/09 |
14 |
|
|
|
Tata Motors |
100 |
1,143 |
|
21.562 |
22.583 |
|
1.020 |
5 |
25,825 |
234 |
|
| 9/21/09 |
10/12/09 |
21 |
|
- cash - |
| |
10/12/09 |
10/26/09 |
14 |
|
|
|
Tata Motors |
100 |
1,216 |
|
21.227 |
21.353 |
|
0.126 |
1 |
25,979 |
17 |
|
| 10/26/09 |
11/09/09 |
14 |
|
- cash - |
| |
11/09/09 |
11/23/09 |
14 |
|
|
|
Tata Motors |
100 |
1,166 |
|
22.264 |
24.618 |
|
2.354 |
11 |
28,723 |
1,274 |
|
| 11/23/09 |
12/28/09 |
35 |
|
- cash - |
| |
12/28/09 |
1/11/10 |
14 |
|
|
|
Tata Motors |
100 |
942 |
|
30.471 |
32.122 |
|
1.651 |
5 |
30,279 |
296 |
|
| 1/11/10 |
4/05/10 |
84 |
|
- cash - |
| |
4/05/10 |
5/03/10 |
28 |
|
|
|
Tata Motors |
100 |
918 |
|
32.967 |
36.015 |
|
3.048 |
9 |
33,076 |
217 |
|
| 5/03/10 |
7/19/10 |
77 |
|
- cash - |
| |
7/19/10 |
8/02/10 |
14 |
|
|
|
Asian Paints |
100 |
731 |
|
45.193 |
48.606 |
|
3.413 |
8 |
35,571 |
567 |
|
| 8/02/10 |
9/27/10 |
56 |
|
- cash - |
| |
9/27/10 |
11/08/10 |
42 |
|
|
|
Tata Motors |
100 |
890 |
|
39.954 |
46.505 |
|
6.551 |
16 |
41,402 |
274 |
|
| 11/08/10 |
4/11/11 |
154 |
|
- cash - |
| |
4/11/11 |
4/18/11 |
7 |
|
|
|
Tata Consultancy |
100 |
365 |
|
113.381 |
110.706 |
|
-2.676 |
-2 |
40,425 |
-71 |
|
| 4/18/11 |
4/25/11 |
7 |
|
- cash - |
| |
4/25/11 |
5/02/11 |
7 |
|
|
|
Tata Consultancy |
100 |
380 |
|
106.377 |
104.174 |
|
-2.203 |
-2 |
39,588 |
-66 |
|
| 5/02/11 |
2/13/12 |
287 |
|
- cash - |
| |
2/13/12 |
3/12/12 |
28 |
|
|
|
Tata Motors |
100 |
989 |
|
40.007 |
46.924 |
|
6.918 |
17 |
46,430 |
700 |
|
| 3/12/12 |
9/24/12 |
196 |
|
- cash - |
| |
9/24/12 |
10/15/12 |
21 |
|
|
|
Hindustan Unilever |
100 |
577 |
|
80.392 |
85.081 |
|
4.689 |
6 |
49,136 |
168 |
|
| 10/15/12 |
10/14/13 |
364 |
|
- cash - |
| |
10/14/13 |
11/11/13 |
28 |
|
|
|
Tata Consultancy |
100 |
276 |
|
177.406 |
164.288 |
|
-13.117 |
-7 |
45,515 |
-63 |
|
| 11/11/13 |
4/28/14 |
168 |
|
- cash - |
| |
4/28/14 |
5/19/14 |
21 |
|
|
|
Larsen & Toubro |
100 |
304 |
|
149.705 |
165.684 |
|
15.979 |
11 |
50,373 |
483 |
|
| 5/19/14 |
6/23/14 |
35 |
|
- cash - |
| |
6/23/14 |
7/21/14 |
28 |
|
|
|
Larsen & Toubro |
100 |
269 |
|
186.759 |
187.366 |
|
0.607 |
0 |
50,536 |
4 |
|
| 7/21/14 |
7/25/16 |
735 |
|
- cash - |
| |
7/25/16 |
8/22/16 |
28 |
|
|
|
Tata Steel |
100 |
8,874 |
|
5.695 |
5.782 |
|
0.088 |
2 |
51,313 |
22 |
|
| 8/22/16 |
2/27/17 |
189 |
|
- cash - |
| |
2/27/17 |
3/13/17 |
14 |
|
|
|
Tata Steel |
100 |
6,325 |
|
8.112 |
8.104 |
|
-0.008 |
0 |
51,262 |
-3 |
|
| 3/13/17 |
9/03/18 |
539 |
|
- cash - |
| |
9/03/18 |
9/10/18 |
7 |
|
|
|
Tata Consultancy |
100 |
160 |
|
320.027 |
318.177 |
|
-1.850 |
-1 |
50,966 |
-26 |
|
| 9/10/18 |
4/15/19 |
217 |
|
- cash - |
| |
4/15/19 |
4/29/19 |
14 |
|
|
|
Axis Bank |
100 |
414 |
|
123.102 |
121.735 |
|
-1.367 |
-1 |
50,400 |
-25 |
|
| 4/29/19 |
5/25/20 |
392 |
|
- cash - |
| |
5/25/20 |
6/15/20 |
21 |
|
|
|
Bharti Airtel |
100 |
599 |
|
84.129 |
77.974 |
|
-6.155 |
-7 |
46,713 |
-73 |
|
| 6/15/20 |
7/06/20 |
21 |
|
- cash - |
| |
7/06/20 |
8/03/20 |
28 |
|
|
|
Reliance Industries |
100 |
175 |
|
266.558 |
283.427 |
|
16.868 |
6 |
49,665 |
123 |
|
| L/S | date buy | date sell | days | | instrument | spl | pieces | | prc buy | prc sell | | prc diff | d % | asset | yield | |
| 8/03/20 |
8/17/20 |
14 |
|
- cash - |
| |
8/17/20 |
8/31/20 |
14 |
|
|
|
Cipla |
100 |
454 |
|
109.376 |
103.115 |
|
-6.261 |
-6 |
46,823 |
-78 |
|
| 8/31/20 |
12/21/20 |
112 |
|
- cash - |
| |
12/21/20 |
2/08/21 |
49 |
|
|
|
Tata Steel |
100 |
5,625 |
|
8.324 |
10.141 |
|
1.817 |
22 |
57,042 |
335 |
|
| 2/08/21 |
5/31/21 |
112 |
|
- cash - |
| |
5/31/21 |
7/12/21 |
42 |
|
|
|
Tata Steel |
100 |
3,357 |
|
16.992 |
18.161 |
|
1.170 |
7 |
60,968 |
78 |
|
| 7/12/21 |
9/27/21 |
77 |
|
- cash - |
| |
9/27/21 |
10/25/21 |
28 |
|
|
|
Tata Steel |
100 |
3,194 |
|
19.088 |
19.598 |
|
0.510 |
3 |
62,598 |
41 |
|
| 10/25/21 |
8/22/22 |
301 |
|
- cash - |
| |
8/22/22 |
8/29/22 |
7 |
|
|
|
Mahindra & Mahindra |
100 |
296 |
|
210.776 |
221.629 |
|
10.853 |
5 |
65,811 |
1,271 |
|
| 8/29/22 |
9/12/22 |
14 |
|
- cash - |
| |
9/12/22 |
9/19/22 |
7 |
|
|
|
Mahindra & Mahindra |
100 |
283 |
|
232.535 |
231.479 |
|
-1.056 |
0 |
65,512 |
-21 |
|
| 9/19/22 |
11/28/22 |
70 |
|
- cash - |
| |
11/28/22 |
12/12/22 |
14 |
|
|
|
ITC |
100 |
1,133 |
|
57.817 |
57.075 |
|
-0.742 |
-1 |
64,671 |
-29 |
|
| 12/12/22 |
5/29/23 |
168 |
|
- cash - |
| |
5/29/23 |
6/12/23 |
14 |
|
|
|
ITC |
100 |
847 |
|
76.338 |
74.041 |
|
-2.297 |
-3 |
62,726 |
-55 |
|
| 6/12/23 |
6/19/23 |
7 |
|
- cash - |
| |
6/19/23 |
8/07/23 |
49 |
|
|
|
ITC |
100 |
798 |
|
78.556 |
78.331 |
|
-0.225 |
0 |
62,546 |
-2 |
|
| 8/07/23 |
12/11/23 |
126 |
|
- cash - |
| |
12/11/23 |
1/22/24 |
42 |
|
|
|
NTPC |
100 |
1,239 |
|
50.471 |
55.035 |
|
4.563 |
9 |
68,200 |
112 |
|
| 1/22/24 |
5/30/26 |
859 |
|
- cash - |
| accum | 1/23/06 |
1/22/24 | 917 |
days out of 7453 invested (12%) |
582 |
68,200 |
115 |
|
Instrument Related Contribution
| instrument | L/S | date buy | date sell | days | prc buy | prc sell | | prc diff | d % | | | total |
| Tata Motors | long | 9/07/09 | 9/21/09 | 14 | 21.56 | 22.58 | | 1.02 | 4.73 | | | |
| | | 10/12/09 | 10/26/09 | 14 | 21.23 | 21.35 | | 0.13 | 0.59 | | | |
| | | 11/09/09 | 11/23/09 | 14 | 22.26 | 24.62 | | 2.35 | 10.57 | | | |
| | | 12/28/09 | 1/11/10 | 14 | 30.47 | 32.12 | | 1.65 | 5.42 | | | |
| | | 4/05/10 | 5/03/10 | 28 | 32.97 | 36.02 | | 3.05 | 9.24 | | | |
| | | 9/27/10 | 11/08/10 | 42 | 39.95 | 46.51 | | 6.55 | 16.40 | | | |
| | | 2/13/12 | 3/12/12 | 28 | 40.01 | 46.92 | | 6.92 | 17.29 | | | 83.16 |
| Maruti Suzuki | | 4/06/09 | 7/20/09 | 105 | 159.81 | 266.82 | | 107.02 | 66.97 | | | 66.97 |
| Tata Steel | | 7/25/16 | 8/22/16 | 28 | 5.69 | 5.78 | | 0.09 | 1.54 | | | |
| | | 2/27/17 | 3/13/17 | 14 | 8.11 | 8.10 | | -0.01 | -0.10 | | | |
| | | 12/21/20 | 2/08/21 | 49 | 8.32 | 10.14 | | 1.82 | 21.83 | | | |
| | | 5/31/21 | 7/12/21 | 42 | 16.99 | 18.16 | | 1.17 | 6.88 | | | |
| | | 9/27/21 | 10/25/21 | 28 | 19.09 | 19.60 | | 0.51 | 2.67 | | | 35.61 |
| Larsen & Toubro | | 10/22/07 | 11/05/07 | 14 | 247.96 | 266.86 | | 18.90 | 7.62 | | | |
| | | 4/28/14 | 5/19/14 | 21 | 149.71 | 165.68 | | 15.98 | 10.67 | | | |
| | | 6/23/14 | 7/21/14 | 28 | 186.76 | 187.37 | | 0.61 | 0.33 | | | 19.50 |
| Bharat Heavy | | 3/13/06 | 5/08/06 | 56 | 37.58 | 39.01 | | 1.44 | 3.83 | | | |
| | | 8/14/06 | 10/23/06 | 70 | 38.08 | 43.35 | | 5.27 | 13.84 | | | 18.20 |
| Lupin | | 1/23/06 | 2/06/06 | 14 | 20.34 | 23.72 | | 3.38 | 16.60 | | | 16.60 |
| NTPC | | 12/11/23 | 1/22/24 | 42 | 50.47 | 55.03 | | 4.56 | 9.04 | | | 9.04 |
| Asian Paints | | 7/19/10 | 8/02/10 | 14 | 45.19 | 48.61 | | 3.41 | 7.55 | | | 7.55 |
| Reliance Industries | | 7/06/20 | 8/03/20 | 28 | 266.56 | 283.43 | | 16.87 | 6.33 | | | 6.33 |
| Hindustan Unilever | | 9/24/12 | 10/15/12 | 21 | 80.39 | 85.08 | | 4.69 | 5.83 | | | 5.83 |
| Mahindra & Mahindra | | 8/22/22 | 8/29/22 | 7 | 210.78 | 221.63 | | 10.85 | 5.15 | | | |
| | | 9/12/22 | 9/19/22 | 7 | 232.54 | 231.48 | | -1.06 | -0.45 | | | 4.67 |
| instrument | L/S | date buy | date sell | days | prc buy | prc sell | | prc diff | d % | | | total |
| Axis Bank | | 4/15/19 | 4/29/19 | 14 | 123.10 | 121.74 | | -1.37 | -1.11 | | | -1.11 |
| ITC | | 11/28/22 | 12/12/22 | 14 | 57.82 | 57.08 | | -0.74 | -1.28 | | | |
| | | 5/29/23 | 6/12/23 | 14 | 76.34 | 74.04 | | -2.30 | -3.01 | | | |
| | | 6/19/23 | 8/07/23 | 49 | 78.56 | 78.33 | | -0.23 | -0.29 | | | -4.53 |
| Cipla | | 8/17/20 | 8/31/20 | 14 | 109.38 | 103.11 | | -6.26 | -5.72 | | | -5.72 |
| Bharti Airtel | | 5/25/20 | 6/15/20 | 21 | 84.13 | 77.97 | | -6.15 | -7.32 | | | -7.32 |
| Tata Consultancy | | 4/11/11 | 4/18/11 | 7 | 113.38 | 110.71 | | -2.68 | -2.36 | | | |
| | | 4/25/11 | 5/02/11 | 7 | 106.38 | 104.17 | | -2.20 | -2.07 | | | |
| | | 10/14/13 | 11/11/13 | 28 | 177.41 | 164.29 | | -13.12 | -7.39 | | | |
| | | 9/03/18 | 9/10/18 | 7 | 320.03 | 318.18 | | -1.85 | -0.58 | | | -11.96 |
Annotations
| 3/04/24 | BSE Sensex 30 | | | Component update: JSW Steel replaces HDFC |
| 1/05/24 | Nestlé India | | | stock split 1:10 (ten for one) |
| 9/18/23 | Power Grid | | | stock split 3:4 (four for three) |
| 7/28/22 | Tata Steel | | | stock split 1:10 (ten for one) |
| 7/29/21 | Power Grid | | | stock split 3:4 (four for three) |
| 12/05/19 | HCL Technologies | | | splits 1:2 (two for one) |
| 9/04/18 | Infosys | | | stock split 1:2 (teo for one) |
| 5/31/18 | Tata Consultancy | | | stock split 1:2 (two for one) |
| 12/21/17 | Mahindra & Mahindra | | | stock split 1:2 (two for one) |
| 9/07/17 | Reliance Industries | | | stock split 1:2 (two for one) |
| 7/13/17 | Larsen & Toubro | | | stock split 2:3 (three for two) |
| 6/13/17 | Wipro | | | stock split 1:2 (two for one) |
| 7/01/16 | ITC | | | stock split 2:3 (three for two) |
| 4/02/16 | BSE Sensex | | | complete analysis |
| | BSE Sensex | | | Adani Ports, Asian Paints and Lupin replace Hindalco, Tata Power and Vedanta |
|
|