| | |
| | |

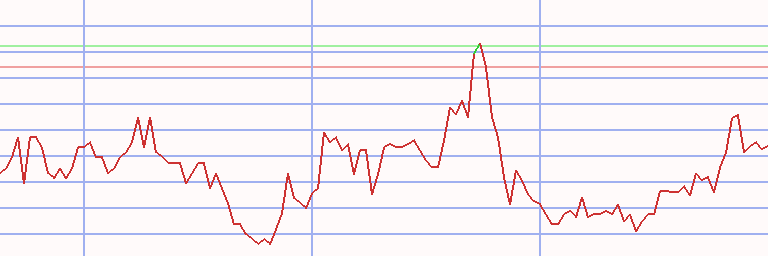
Assessment - Hang Seng Index in Japanese yen - 7/01/24 - RS = 38
⇐
| |
|
⇓instrument |
freshest |
Δday |
7/01/24 |
⇓ Δwk |
10/09/23 |
prc diff |
⇓ Δ38 |
|
⇓∅-RS |
| |  |
 |
 |
|
L |
 |
HSI |
354,032.783 |
8/12/24 |
0.13 |
366,589.250 |
-3.43 |
332,694.772 |
33,894.478 |
10.19 |
|
10.55 |
| | |
|
|
|
|
|
WuXi Biologics |
243.722 |
8/12/24 |
3.70 |
238.757 |
2.08 |
852.752 |
-613.995 |
-72.00 |
|
-46.62 |
| | |
|
|
|
L |
|
Lenovo |
212.688 |
8/12/24 |
2.59 |
227.998 |
-6.72 |
157.256 |
70.743 |
44.99 |
|
32.60 |
| | |
|
|
|
L |
|
Orient Overseas |
2,157.916 |
8/12/24 |
2.25 |
2,621.362 |
-17.68 |
1,997.984 |
623.377 |
31.20 |
|
24.78 |
| | |
|
|
|
S |
|
Sino Biopharm |
61.034 |
8/12/24 |
2.08 |
55.241 |
10.49 |
52.229 |
3.012 |
5.77 |
|
-5.73 |
| | |
|
|
|
L |
|
ICBC |
92.689 |
8/12/24 |
2.05 |
95.999 |
-3.45 |
69.891 |
26.108 |
37.35 |
|
30.65 |
| | |
|
|
|
|
|
HK & China Gas |
136.965 |
8/12/24 |
1.85 |
122.896 |
11.45 |
104.078 |
18.818 |
18.08 |
|
9.90 |
| | |
|
|
|
L |
|
Haier Smart Home |
502.755 |
8/12/24 |
1.67 |
539.996 |
-6.90 |
441.570 |
98.427 |
22.29 |
|
17.99 |
| | |
|
|
|
L |
|
China Shenhua HK |
668.271 |
8/12/24 |
1.57 |
743.788 |
-10.15 |
474.806 |
268.982 |
56.65 |
|
44.38 |
| | |
|
|
|
S |
|
Nongfu Spring |
608.272 |
8/12/24 |
1.55 |
766.547 |
-20.65 |
842.306 |
-75.760 |
-8.99 |
|
-7.38 |
| | |
|
|
|
L |
|
China Constr Bk HK |
114.827 |
8/12/24 |
1.46 |
119.379 |
-3.81 |
82.996 |
36.382 |
43.84 |
|
34.66 |
| | |
|
|
|
S |
|
WuXi AppTec HK |
727.236 |
8/12/24 |
1.44 |
604.134 |
20.38 |
1,790.019 |
-1,185.885 |
-66.25 |
|
-44.66 |
| | |
|
|
|
L |
|
Tencent |
7,758.568 |
8/12/24 |
1.35 |
7,704.776 |
0.70 |
5,830.620 |
1,874.156 |
32.14 |
|
28.92 |
| | |
|
|
|
L |
|
China Hongqiao |
205.240 |
8/12/24 |
1.33 |
244.550 |
-16.07 |
138.453 |
106.097 |
76.63 |
|
77.04 |
| | |
|
|
|
L |
|
Sunny Optical |
894.822 |
8/12/24 |
1.29 |
998.269 |
-10.36 |
987.597 |
10.672 |
1.08 |
|
-5.71 |
| | |
|
|
|
L |
|
Bank of China |
70.344 |
8/12/24 |
1.19 |
79.655 |
-11.69 |
51.849 |
27.806 |
53.63 |
|
39.84 |
| | |
|
|
|
L |
|
Sinopharm |
417.928 |
8/12/24 |
1.10 |
429.307 |
-2.65 |
413.081 |
16.226 |
3.93 |
|
7.62 |
| | |
|
|
|
L |
|
CSPC Pharmaceutical |
122.689 |
8/12/24 |
1.02 |
128.689 |
-4.66 |
104.457 |
24.231 |
23.20 |
|
7.50 |
| | |
|
|
|
L |
|
HK Exchgs & Clrg |
4,791.692 |
8/12/24 |
0.96 |
5,176.517 |
-7.43 |
5,484.961 |
-308.444 |
-5.62 |
|
1.77 |
| | |
|
|
|
L |
|
ENN Energy |
1,104.820 |
8/12/24 |
0.85 |
1,331.370 |
-17.02 |
1,208.856 |
122.514 |
10.13 |
|
8.44 |
| | |
|
|
|
|
|
Alibaba |
1,623.092 |
8/12/24 |
0.77 |
1,458.611 |
11.28 |
1,559.263 |
-100.653 |
-6.46 |
|
-1.41 |
| | |
|
|
|
|
|
Zijin Mining HK |
316.550 |
8/12/24 |
0.66 |
340.963 |
-7.16 |
224.109 |
116.855 |
52.14 |
|
35.94 |
| | |
|
|
|
L |
|
HSBC |
1,331.370 |
8/12/24 |
0.63 |
1,413.094 |
-5.78 |
1,177.519 |
235.575 |
20.01 |
|
20.23 |
| | |
|
|
|
|
|
Sinopec |
102.620 |
8/12/24 |
0.61 |
104.689 |
-1.98 |
78.248 |
26.441 |
33.79 |
|
26.91 |
| | |
|
|
|
L |
|
China Life Ins HK |
214.757 |
8/12/24 |
0.58 |
228.412 |
-5.98 |
224.488 |
3.924 |
1.75 |
|
12.37 |
| |
|
⇓instrument |
freshest |
Δday |
7/01/24 |
⇓ Δwk |
10/09/23 |
prc diff |
⇓ Δ38 |
|
⇓∅-RS |
| | |
|
|
|
|
|
Trip.com |
6,844.092 |
8/12/24 |
0.55 |
7,750.293 |
-11.69 |
4,934.186 |
2,816.107 |
57.07 |
|
32.32 |
| | |
|
|
|
|
|
NetEase |
2,913.084 |
8/12/24 |
0.50 |
3,084.807 |
-5.57 |
3,042.558 |
42.249 |
1.39 |
|
3.03 |
| | |
|
|
|
L |
|
Ping An |
696.202 |
8/12/24 |
0.45 |
732.409 |
-4.94 |
826.163 |
-93.754 |
-11.35 |
|
-1.04 |
| | |
|
|
|
L |
|
Hang Seng Bank |
1,901.366 |
8/12/24 |
0.38 |
2,077.227 |
-8.47 |
1,815.659 |
261.569 |
14.41 |
|
15.02 |
| | |
|
|
|
|
|
Xiaomi |
340.549 |
8/12/24 |
0.37 |
340.963 |
-0.12 |
226.767 |
114.196 |
50.36 |
|
30.59 |
| | |
|
|
|
|
|
CK Infrastructure |
1,147.234 |
8/12/24 |
0.36 |
912.408 |
25.74 |
693.217 |
219.191 |
31.62 |
|
15.20 |
| | |
|
|
|
S |
|
CK Property |
640.341 |
8/12/24 |
0.32 |
605.168 |
5.81 |
770.136 |
-164.967 |
-21.42 |
|
-15.15 |
| | |
|
|
|
|
|
Xinyi Solar |
73.034 |
8/12/24 |
0.28 |
81.310 |
-10.18 |
104.647 |
-23.337 |
-22.30 |
|
-19.33 |
| | |
|
|
|
|
|
Geely Auto |
157.861 |
8/12/24 |
0.26 |
181.861 |
-13.20 |
170.360 |
11.500 |
6.75 |
|
5.91 |
| | |
|
|
|
L |
|
China Res Power |
454.135 |
8/12/24 |
0.23 |
495.514 |
-8.35 |
275.008 |
220.506 |
80.18 |
|
55.27 |
| | |
|
|
|
|
|
MTR |
535.858 |
8/12/24 |
0.19 |
509.997 |
5.07 |
575.465 |
-65.468 |
-11.38 |
|
-6.89 |
| | |
|
|
|
|
|
CK Hutchison |
835.856 |
8/12/24 |
0.12 |
773.788 |
8.02 |
774.884 |
-1.096 |
-0.14 |
|
-0.70 |
| | |
|
|
|
L |
|
Bank of China (HK) |
461.376 |
8/12/24 |
|
497.583 |
-7.28 |
406.434 |
91.149 |
22.43 |
|
20.93 |
| | |
|
|
|
L |
|
China Merchants B HK |
672.409 |
8/12/24 |
|
733.443 |
-8.32 |
604.903 |
128.540 |
21.25 |
|
24.05 |
| | |
|
|
|
|
|
Citic Pacific |
146.896 |
8/12/24 |
|
146.896 |
|
131.426 |
15.469 |
11.77 |
|
1.03 |
| | |
|
|
|
|
|
PetroChina |
137.999 |
8/12/24 |
|
163.447 |
-15.57 |
107.116 |
56.331 |
52.59 |
|
46.26 |
| | |
|
|
|
|
|
WH Group |
108.827 |
8/12/24 |
|
106.344 |
2.33 |
78.818 |
27.526 |
34.92 |
|
19.70 |
| | |
|
|
|
|
|
CLP |
1,427.577 |
8/12/24 |
-0.07 |
1,305.508 |
9.35 |
1,077.810 |
227.698 |
21.13 |
|
11.70 |
| | |
|
|
|
L |
|
JD.com |
2,071.021 |
8/12/24 |
-0.10 |
2,137.227 |
-3.10 |
2,161.318 |
-24.091 |
-1.11 |
|
1.27 |
| | |
|
|
|
|
|
Xinyi Glass |
156.206 |
8/12/24 |
-0.13 |
177.102 |
-11.80 |
180.426 |
-3.324 |
-1.84 |
|
1.52 |
| | |
|
|
|
|
|
Hengan |
524.479 |
8/12/24 |
-0.20 |
492.410 |
6.51 |
470.058 |
22.352 |
4.76 |
|
-4.11 |
| | |
|
|
|
L |
|
SMIC |
342.205 |
8/12/24 |
-0.24 |
354.205 |
-3.39 |
369.969 |
-15.764 |
-4.26 |
|
3.81 |
| | |
|
|
|
L |
|
Shenzhou Inter |
1,280.681 |
8/12/24 |
-0.24 |
1,581.713 |
-19.03 |
1,376.938 |
204.776 |
14.87 |
|
10.85 |
| | |
|
|
|
|
|
Techtronic Inds |
1,997.573 |
8/12/24 |
-0.26 |
1,845.505 |
8.24 |
1,388.333 |
457.172 |
32.93 |
|
12.32 |
| | |
|
|
|
L |
|
BYD Company |
4,419.281 |
8/12/24 |
-0.28 |
4,799.968 |
-7.93 |
4,463.178 |
336.790 |
7.55 |
|
13.88 |
| |
|
⇓instrument |
freshest |
Δday |
7/01/24 |
⇓ Δwk |
10/09/23 |
prc diff |
⇓ Δ38 |
|
⇓∅-RS |
| | |
|
|
|
S |
|
Power Assets |
1,115.165 |
8/12/24 |
-0.28 |
874.132 |
27.57 |
702.713 |
171.419 |
24.39 |
|
9.11 |
| | |
|
|
|
L |
|
China Mobile |
1,466.887 |
8/12/24 |
-0.56 |
1,593.093 |
-7.92 |
1,237.345 |
355.748 |
28.75 |
|
26.80 |
| | |
|
|
|
S |
|
Link REIT |
721.030 |
8/12/24 |
-0.57 |
627.927 |
14.83 |
700.814 |
-72.887 |
-10.40 |
|
-12.86 |
| | |
|
|
|
L |
|
Alibaba Health |
67.034 |
8/12/24 |
-0.61 |
64.758 |
3.51 |
89.643 |
-24.885 |
-27.76 |
|
-12.28 |
| | |
|
|
|
S |
|
Baidu |
1,709.988 |
8/12/24 |
-0.66 |
1,763.781 |
-3.05 |
2,450.000 |
-686.219 |
-28.01 |
|
-17.51 |
| | |
|
|
|
L |
|
Tingyi |
185.999 |
8/12/24 |
-0.66 |
194.688 |
-4.46 |
204.736 |
-10.048 |
-4.91 |
|
5.91 |
| | |
|
|
|
S |
|
Chow Tai Fook Jwl |
136.137 |
8/12/24 |
-0.75 |
174.826 |
-22.13 |
212.333 |
-37.507 |
-17.66 |
|
-19.36 |
| | |
|
|
|
L |
|
CNOOC |
408.411 |
8/12/24 |
-0.80 |
463.445 |
-11.88 |
254.496 |
208.949 |
82.10 |
|
68.96 |
| | |
|
|
|
L |
|
China Ov Land & Inv |
264.412 |
8/12/24 |
-0.93 |
280.136 |
-5.61 |
300.077 |
-19.941 |
-6.65 |
|
5.45 |
| | |
|
|
|
L |
|
China Res Land |
470.686 |
8/12/24 |
-1.09 |
549.307 |
-14.31 |
566.919 |
-17.612 |
-3.11 |
|
3.05 |
| | |
|
|
|
|
|
Zhongsheng |
220.136 |
8/12/24 |
-1.12 |
236.274 |
-6.83 |
378.326 |
-142.051 |
-37.55 |
|
-28.35 |
| | |
|
|
|
L |
|
China Res Mixc |
452.066 |
8/12/24 |
-1.13 |
534.824 |
-15.47 |
572.616 |
-37.792 |
-6.60 |
|
-1.69 |
| | |
|
|
|
|
|
Li Ning |
290.895 |
8/12/24 |
-1.13 |
349.653 |
-16.80 |
602.054 |
-252.401 |
-41.92 |
|
-23.55 |
| | |
|
|
|
L |
|
AIA |
1,073.786 |
8/12/24 |
-1.33 |
1,096.544 |
-2.08 |
1,277.229 |
-180.684 |
-14.15 |
|
-10.64 |
| | |
|
|
|
S |
|
Hang Lung |
115.654 |
8/12/24 |
-1.41 |
137.792 |
-16.07 |
202.837 |
-65.045 |
-32.07 |
|
-24.34 |
| | |
|
|
|
|
|
Country Garden Svcs |
97.034 |
8/12/24 |
-1.47 |
99.723 |
-2.70 |
144.151 |
-44.428 |
-30.82 |
|
-19.60 |
| | |
|
|
|
|
|
Wharf REIC |
445.859 |
8/12/24 |
-1.60 |
428.273 |
4.11 |
551.725 |
-123.452 |
-22.38 |
|
-17.94 |
| | |
|
|
|
S |
|
Li Auto |
1,593.093 |
8/12/24 |
-1.79 |
1,454.473 |
9.53 |
2,543.062 |
-1,088.589 |
-42.81 |
|
-39.76 |
| | |
|
|
|
|
|
Sun Hung Kai |
1,480.335 |
8/12/24 |
-1.85 |
1,397.577 |
5.92 |
1,593.449 |
-195.873 |
-12.29 |
|
-8.50 |
| | |
|
|
|
|
|
Haidilao Inter |
252.826 |
8/12/24 |
-1.93 |
290.481 |
-12.96 |
399.787 |
-109.306 |
-27.34 |
|
-9.89 |
| | |
|
|
|
L |
|
Longfor |
197.585 |
8/12/24 |
-1.95 |
221.792 |
-10.91 |
248.798 |
-27.007 |
-10.85 |
|
-5.26 |
| | |
|
|
|
L |
|
Meituan |
2,151.710 |
8/12/24 |
-2.07 |
2,298.605 |
-6.39 |
2,068.256 |
230.350 |
11.14 |
|
19.97 |
| | |
|
|
|
S |
|
Budweiser Brewing |
192.412 |
8/12/24 |
-2.11 |
190.344 |
1.09 |
292.101 |
-101.757 |
-34.84 |
|
-26.75 |
| | |
|
|
|
L |
|
Hansoh Pharma |
382.756 |
8/12/24 |
-2.22 |
337.653 |
13.36 |
195.240 |
142.413 |
72.94 |
|
34.76 |
| | |
|
|
|
|
|
Henderson Land |
456.204 |
8/12/24 |
-2.43 |
433.445 |
5.25 |
385.543 |
47.903 |
12.42 |
|
2.82 |
| |
|
⇓instrument |
freshest |
Δday |
7/01/24 |
⇓ Δwk |
10/09/23 |
prc diff |
⇓ Δ38 |
|
⇓∅-RS |
| | |
|
|
|
|
|
China Res Beer |
490.342 |
8/12/24 |
-2.47 |
543.100 |
-9.71 |
806.221 |
-263.121 |
-32.64 |
|
-23.72 |
| | |
|
|
|
|
|
JD Health |
435.514 |
8/12/24 |
-2.55 |
439.652 |
-0.94 |
723.605 |
-283.952 |
-39.24 |
|
-32.49 |
| | |
|
|
|
|
|
New World Dev |
149.792 |
8/12/24 |
-2.69 |
151.240 |
-0.96 |
284.124 |
-132.884 |
-46.77 |
|
-31.27 |
| | |
|
|
|
|
|
ANTA Sports Products |
1,413.094 |
8/12/24 |
-2.78 |
1,551.714 |
-8.93 |
1,620.039 |
-68.325 |
-4.22 |
|
-0.04 |
| | |
|
|
|
S |
|
China Mengniu Dairy |
273.929 |
8/12/24 |
-2.79 |
289.653 |
-5.43 |
490.000 |
-200.347 |
-40.89 |
|
-26.94 |
| | |
|
|
|
S |
|
Sands China |
280.550 |
8/12/24 |
-2.87 |
336.825 |
-16.71 |
428.275 |
-91.450 |
-21.35 |
|
-21.36 |
| | |
|
|
|
L |
|
Galaxy Entertainment |
609.306 |
8/12/24 |
-4.38 |
753.098 |
-19.09 |
861.298 |
-108.200 |
-12.56 |
|
-9.00 |
| | |
|
|
|
L |
|
China Unicom |
123.516 |
8/12/24 |
-5.84 |
148.344 |
-16.74 |
106.736 |
41.607 |
38.98 |
|
43.53 |
| HSI - 82 out of 82 instruments rated - 7/01/24 / 10/09/23 - 43 did rise, Market-Ratio(38) in JPY = 52.44 % |
| Stock Exchange Currency: HKD $ Hong Kong dollar |
Technical Chart
Transactions Hang Seng Index in Japanese yen * L38 - 82/74 (1)
|
⇐ |
| |
| L/S | date buy | date sell | days | | instrument | spl | pieces | | prc buy | prc sell | | prc diff | d % | asset | yield | |
| 1/02/06 |
4/28/08 |
847 |
|
- cash - |
| long |
4/28/08 |
5/12/08 |
14 |
|
|
|
Tencent |
100 |
66 |
|
149.466 |
176.623 |
|
27.156 |
18 |
11,792 |
7,667 |
|
| 5/12/08 |
6/29/09 |
413 |
|
- cash - |
| |
6/29/09 |
4/19/10 |
294 |
|
|
|
Geely Auto |
100 |
675 |
|
17.450 |
42.934 |
|
25.484 |
146 |
28,994 |
206 |
|
| 4/19/10 |
10/11/10 |
175 |
|
- cash - |
| |
10/11/10 |
12/20/10 |
70 |
|
|
|
Galaxy Entertainment |
100 |
404 |
|
71.682 |
90.940 |
|
19.258 |
27 |
36,774 |
246 |
|
| 12/20/10 |
1/24/11 |
35 |
|
- cash - |
| |
1/24/11 |
3/14/11 |
49 |
|
|
|
Galaxy Entertainment |
100 |
318 |
|
115.333 |
118.375 |
|
3.042 |
3 |
37,741 |
21 |
|
| 3/14/11 |
4/04/11 |
21 |
|
- cash - |
| |
4/04/11 |
5/30/11 |
56 |
|
|
|
Galaxy Entertainment |
100 |
291 |
|
129.254 |
175.799 |
|
46.545 |
36 |
51,286 |
642 |
|
| 5/30/11 |
8/13/12 |
441 |
|
- cash - |
| |
8/13/12 |
8/20/12 |
7 |
|
|
|
Tencent |
100 |
102 |
|
501.094 |
502.745 |
|
1.651 |
0 |
51,454 |
19 |
|
| 8/20/12 |
12/24/12 |
126 |
|
- cash - |
| |
12/24/12 |
6/03/13 |
161 |
|
|
|
Galaxy Entertainment |
100 |
157 |
|
326.067 |
533.976 |
|
207.908 |
64 |
84,096 |
206 |
|
| 6/03/13 |
11/03/14 |
518 |
|
- cash - |
| |
11/03/14 |
11/10/14 |
7 |
|
|
|
China Mobile |
100 |
59 |
|
1,414.500 |
1,428.864 |
|
14.363 |
1 |
84,943 |
69 |
|
| 11/10/14 |
10/10/16 |
700 |
|
- cash - |
| |
10/10/16 |
11/28/16 |
49 |
|
|
|
Geely Auto |
100 |
887 |
|
95.750 |
115.087 |
|
19.338 |
20 |
102,096 |
294 |
|
| 11/28/16 |
2/13/17 |
77 |
|
- cash - |
| |
2/13/17 |
4/24/17 |
70 |
|
|
|
Geely Auto |
100 |
646 |
|
158.008 |
161.138 |
|
3.130 |
2 |
104,118 |
11 |
|
| 4/24/17 |
7/17/17 |
84 |
|
- cash - |
| |
7/17/17 |
11/20/17 |
126 |
|
|
|
Geely Auto |
100 |
385 |
|
270.175 |
403.038 |
|
132.863 |
49 |
155,270 |
219 |
|
| 11/20/17 |
1/15/18 |
56 |
|
- cash - |
| |
1/15/18 |
2/12/18 |
28 |
|
|
|
Geely Auto |
100 |
420 |
|
369.613 |
306.725 |
|
-62.888 |
-17 |
128,857 |
-91 |
|
| 2/12/18 |
3/22/21 |
1134 |
|
- cash - |
| |
3/22/21 |
3/29/21 |
7 |
|
|
|
Lenovo |
100 |
973 |
|
132.343 |
141.766 |
|
9.423 |
7 |
138,026 |
3,511 |
|
| 3/29/21 |
4/26/21 |
28 |
|
- cash - |
| |
4/26/21 |
5/17/21 |
21 |
|
|
|
Lenovo |
100 |
924 |
|
149.365 |
130.666 |
|
-18.699 |
-13 |
120,748 |
-90 |
|
| 5/17/21 |
5/31/21 |
14 |
|
- cash - |
| |
5/31/21 |
7/12/21 |
42 |
|
|
|
Lenovo |
100 |
920 |
|
131.199 |
125.597 |
|
-5.601 |
-4 |
115,594 |
-32 |
|
| 7/12/21 |
7/24/23 |
742 |
|
- cash - |
| |
7/24/23 |
7/31/23 |
7 |
|
|
|
PetroChina |
100 |
1,109 |
|
104.195 |
103.679 |
|
-0.517 |
0 |
115,022 |
-23 |
|
| 7/31/23 |
5/30/26 |
1034 |
|
- cash - |
| accum | 4/28/08 |
7/31/23 | 1008 |
days out of 7453 invested (14%) |
1,050 |
115,022 |
142 |
|
Instrument Related Contribution
| instrument | L/S | date buy | date sell | days | prc buy | prc sell | | prc diff | d % | | | total |
| Geely Auto | long | 6/29/09 | 4/19/10 | 294 | 17.45 | 42.93 | | 25.48 | 146.04 | | | |
| | | 10/10/16 | 11/28/16 | 49 | 95.75 | 115.09 | | 19.34 | 20.20 | | | |
| | | 2/13/17 | 4/24/17 | 70 | 158.01 | 161.14 | | 3.13 | 1.98 | | | |
| | | 7/17/17 | 11/20/17 | 126 | 270.18 | 403.04 | | 132.86 | 49.18 | | | |
| | | 1/15/18 | 2/12/18 | 28 | 369.61 | 306.72 | | -62.89 | -17.01 | | | 273.35 |
| Galaxy Entertainment | | 10/11/10 | 12/20/10 | 70 | 71.68 | 90.94 | | 19.26 | 26.87 | | | |
| | | 1/24/11 | 3/14/11 | 49 | 115.33 | 118.37 | | 3.04 | 2.64 | | | |
| | | 4/04/11 | 5/30/11 | 56 | 129.25 | 175.80 | | 46.54 | 36.01 | | | |
| | | 12/24/12 | 6/03/13 | 161 | 326.07 | 533.98 | | 207.91 | 63.76 | | | 190.03 |
| Tencent | | 4/28/08 | 5/12/08 | 14 | 149.47 | 176.62 | | 27.16 | 18.17 | | | |
| | | 8/13/12 | 8/20/12 | 7 | 501.09 | 502.75 | | 1.65 | 0.33 | | | 18.56 |
| China Mobile | | 11/03/14 | 11/10/14 | 7 | 1,414.50 | 1,428.86 | | 14.36 | 1.02 | | | 1.02 |
| PetroChina | | 7/24/23 | 7/31/23 | 7 | 104.20 | 103.68 | | -0.52 | -0.50 | | | -0.50 |
| Lenovo | | 3/22/21 | 3/29/21 | 7 | 132.34 | 141.77 | | 9.42 | 7.12 | | | |
| | | 4/26/21 | 5/17/21 | 21 | 149.37 | 130.67 | | -18.70 | -12.52 | | | |
| | | 5/31/21 | 7/12/21 | 42 | 131.20 | 125.60 | | -5.60 | -4.27 | | | -10.29 |
Annotations
| 5/23/18 | HSI | | | index adaption
removed: Cathay Pacific Airways, Kunlun Energy, The Wharf
added: Country Garden, Sunny Optical Technology, WH Group, Wharf REIC |
| 7/19/17 | HSI | | | Belle drops out due to acquisition by Hillhouse Capital and CDH Investments |
| 4/01/17 | HSI | | | machine learning processed for all techniques |
| 3/06/17 | HSI | | | Geely Auto replaces Li & Fung |
| 12/28/16 | HSI | | | AAC Technologies and CKI replacen China Res Enterprises and Tingyi |
| 10/13/15 | China Mengniu Dairy | | | forward stock split 1:2 (two for one) |
| 9/18/15 | China Res Enterprise | | | ex special dividend HKD 12.30 |
| 7/27/15 | Ping An HK | | | forward stock split 10:20 (twenty for ten) |
| 6/08/15 | HSI | | | CK Property and The Link REIT replace Costco and Hutchison Whampoa. |
| 6/01/15 | CK Hutchison | | | name change (before Cheung Kong Holdings Ltd) after Merger with Hutchison Whampoa |
| 5/27/15 | CK Hutchison | | | spin-off CK Property |
|
|