| | Sat, Jun 13th, 2026, 1:37UTC |
| | |

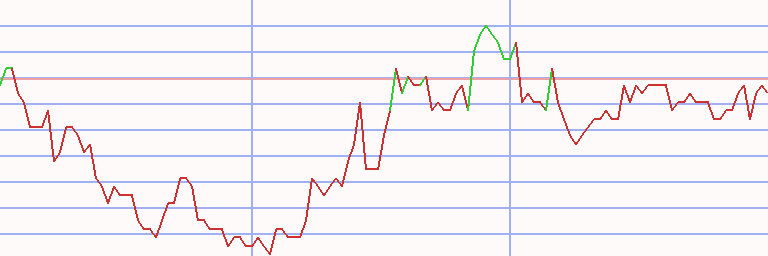
Assessment - Swiss Leader Index in Dollar - 7/01/24 - RS = 43
⇐
| |
|
instrument |
freshest |
⇓ Δday |
7/01/24 |
⇓ Δwk |
9/04/23 |
prc diff |
⇓ Δ43 |
|
⇓∅-RS |
| |  |
 |
 |
|
L |
 |
SLI® PR |
2,123.793 |
8/12/24 |
0.02 |
2,159.781 |
-1.67 |
1,972.583 |
187.199 |
9.49 |
|
7.08 |
| | |
|
|
|
L |
|
ABB |
50.364 |
8/12/24 |
0.55 |
55.753 |
-9.67 |
37.693 |
18.060 |
47.92 |
|
33.17 |
| | |
|
|
|
S |
|
Adecco |
31.097 |
8/12/24 |
-0.78 |
33.354 |
-6.77 |
42.602 |
-9.248 |
-21.71 |
|
-17.54 |
| | |
|
|
|
L |
|
Alcon |
88.045 |
8/12/24 |
-1.12 |
88.731 |
-0.77 |
82.354 |
6.378 |
7.74 |
|
11.19 |
| | |
|
|
|
L |
|
ams-OSRAM |
1.107 |
8/12/24 |
-0.20 |
1.380 |
-19.77 |
7.201 |
-5.821 |
-80.84 |
|
-40.76 |
| | |
|
|
|
L |
|
Geberit |
578.556 |
8/12/24 |
-0.72 |
585.639 |
-1.21 |
516.293 |
69.345 |
13.43 |
|
5.90 |
| | |
|
|
|
L |
|
Givaudan |
4,578.209 |
8/12/24 |
-1.12 |
4,760.806 |
-3.84 |
3,305.454 |
1,455.352 |
44.03 |
|
25.64 |
| | |
|
|
|
|
|
Holcim |
84.415 |
8/12/24 |
-0.34 |
88.421 |
-4.53 |
65.227 |
23.195 |
35.56 |
|
19.27 |
| | |
|
|
|
L |
|
Julius Bär |
52.765 |
8/12/24 |
0.87 |
56.483 |
-6.58 |
69.344 |
-12.861 |
-18.55 |
|
-4.10 |
| | |
|
|
|
|
|
Kühne & Nagel |
280.868 |
8/12/24 |
0.40 |
289.389 |
-2.94 |
290.047 |
-0.659 |
-0.23 |
|
-2.16 |
| | |
|
|
|
|
|
Lindt PS |
12,018.213 |
8/12/24 |
-1.54 |
11,675.152 |
2.94 |
11,787.418 |
-112.266 |
-0.95 |
|
-1.94 |
| | |
|
|
|
L |
|
Logitech |
83.309 |
8/12/24 |
1.95 |
96.500 |
-13.67 |
70.295 |
26.205 |
37.28 |
|
21.83 |
| | |
|
|
|
|
|
Lonza |
603.124 |
8/12/24 |
-1.80 |
540.488 |
11.59 |
560.298 |
-19.811 |
-3.54 |
|
10.05 |
| | |
|
|
|
L |
|
Nestlé |
98.093 |
8/12/24 |
-0.40 |
101.679 |
-3.53 |
118.824 |
-17.145 |
-14.43 |
|
-9.08 |
| | |
|
|
|
L |
|
Novartis |
107.057 |
8/12/24 |
0.16 |
107.035 |
0.02 |
100.713 |
6.322 |
6.28 |
|
6.99 |
| | |
|
|
|
|
|
Partners |
1,255.494 |
8/12/24 |
0.93 |
1,269.880 |
-1.13 |
1,090.958 |
178.922 |
16.40 |
|
3.39 |
| | |
|
|
|
L |
|
Richemont |
141.872 |
8/12/24 |
1.22 |
155.540 |
-8.79 |
142.083 |
13.457 |
9.47 |
|
9.59 |
| | |
|
|
|
L |
|
Roche |
307.427 |
8/12/24 |
0.25 |
276.773 |
11.08 |
291.461 |
-14.688 |
-5.04 |
|
0.89 |
| | |
|
|
|
|
|
Schindler |
250.988 |
8/12/24 |
-0.09 |
250.324 |
0.27 |
217.366 |
32.958 |
15.16 |
|
6.45 |
| | |
|
|
|
|
|
SGS |
101.391 |
8/12/24 |
-0.17 |
88.643 |
14.38 |
91.720 |
-3.078 |
-3.36 |
|
-1.34 |
| | |
|
|
|
|
|
Sika |
273.785 |
8/12/24 |
0.04 |
282.306 |
-3.02 |
279.979 |
2.327 |
0.83 |
|
0.05 |
| | |
|
|
|
L |
|
Sonova |
307.759 |
8/12/24 |
-1.52 |
310.194 |
-0.78 |
263.463 |
46.730 |
17.74 |
|
10.04 |
| | |
|
|
|
S |
|
Straumann |
124.332 |
8/12/24 |
0.76 |
124.719 |
-0.31 |
154.356 |
-29.637 |
-19.20 |
|
-13.90 |
| | |
|
|
|
S |
|
Swatch |
199.142 |
8/12/24 |
-0.17 |
204.675 |
-2.70 |
288.690 |
-84.015 |
-29.10 |
|
-18.42 |
| | |
|
|
|
|
|
Swiss Life |
721.757 |
8/12/24 |
0.62 |
740.570 |
-2.54 |
623.534 |
117.036 |
18.77 |
|
11.82 |
| |
|
instrument |
freshest |
⇓ Δday |
7/01/24 |
⇓ Δwk |
9/04/23 |
prc diff |
⇓ Δ43 |
|
⇓∅-RS |
| | |
|
|
|
|
|
Swiss Re |
115.092 |
8/12/24 |
0.10 |
124.387 |
-7.47 |
96.245 |
28.142 |
29.24 |
|
11.96 |
| | |
|
|
|
|
|
Swisscom |
580.991 |
8/12/24 |
0.48 |
562.731 |
3.24 |
604.077 |
-41.346 |
-6.84 |
|
-4.44 |
| | |
|
|
|
|
|
Temenos |
62.858 |
8/12/24 |
1.88 |
69.166 |
-9.12 |
78.145 |
-8.980 |
-11.49 |
|
-9.56 |
| | |
|
|
|
|
|
UBS |
27.500 |
8/12/24 |
0.44 |
29.857 |
-7.89 |
26.821 |
3.036 |
11.32 |
|
12.37 |
| | |
|
|
|
|
|
VAT |
449.964 |
8/12/24 |
-0.34 |
559.743 |
-19.61 |
405.659 |
154.084 |
37.98 |
|
25.96 |
| | |
|
|
|
L |
|
Zurich Insurance |
514.260 |
8/12/24 |
0.85 |
534.290 |
-3.75 |
466.406 |
67.884 |
14.55 |
|
7.66 |
| SLI - 30 out of 30 instruments rated - 7/01/24 / 9/04/23 - 17 did rise, Market-Ratio(43) in USD = 56.67 % |
| Stock Exchange Currency: CHF ₣ Swiss Franc |
Technical Chart
Transactions Swiss Leader Index in Dollar * L43 - 69 ex 10 (1)
|
⇐ |
| |
| L/S | date buy | date sell | days | | instrument | spl | pieces | | prc buy | prc sell | | prc diff | d % | asset | yield | | | long |
1/02/06 |
8/20/07 |
595 |
|
|
|
ABB |
100 |
1,002 |
|
9.970 |
22.018 |
|
12.048 |
121 |
22,072 |
63 |
|
| 8/20/07 |
10/08/07 |
49 |
|
- cash - |
| |
10/08/07 |
10/22/07 |
14 |
|
|
|
ABB |
100 |
817 |
|
26.985 |
27.086 |
|
0.101 |
0 |
22,155 |
10 |
|
| 10/22/07 |
10/29/07 |
7 |
|
- cash - |
| |
10/29/07 |
11/05/07 |
7 |
|
|
|
ABB |
100 |
736 |
|
30.068 |
30.909 |
|
0.841 |
3 |
22,773 |
321 |
|
| 11/05/07 |
8/24/09 |
658 |
|
- cash - |
| |
8/24/09 |
9/07/09 |
14 |
|
|
|
Swiss Re |
100 |
503 |
|
45.259 |
44.074 |
|
-1.185 |
-3 |
22,177 |
-50 |
|
| 9/07/09 |
9/14/09 |
7 |
|
- cash - |
| |
9/14/09 |
6/07/10 |
266 |
|
|
|
Temenos |
100 |
982 |
|
22.584 |
22.113 |
|
-0.471 |
-2 |
21,715 |
-3 |
|
| |
6/07/10 |
7/05/10 |
28 |
|
|
|
ams-OSRAM |
100 |
3,351 |
|
6.479 |
6.633 |
|
0.154 |
2 |
22,231 |
36 |
|
| 7/05/10 |
8/02/10 |
28 |
|
- cash - |
| |
8/02/10 |
8/09/10 |
7 |
|
|
|
ams-OSRAM |
100 |
3,263 |
|
6.811 |
7.238 |
|
0.427 |
6 |
23,624 |
2,280 |
|
| 8/09/10 |
9/06/10 |
28 |
|
- cash - |
| |
9/06/10 |
9/13/10 |
7 |
|
|
|
Schindler |
100 |
234 |
|
100.728 |
99.742 |
|
-0.986 |
-1 |
23,393 |
-40 |
|
| 9/13/10 |
9/20/10 |
7 |
|
- cash - |
| |
9/20/10 |
10/04/10 |
14 |
|
|
|
Schindler |
100 |
223 |
|
104.483 |
106.495 |
|
2.012 |
2 |
23,842 |
64 |
|
| 10/04/10 |
10/11/10 |
7 |
|
- cash - |
| |
10/11/10 |
11/08/10 |
28 |
|
|
|
Richemont |
100 |
475 |
|
50.095 |
55.346 |
|
5.251 |
10 |
26,336 |
267 |
|
| 11/08/10 |
11/15/10 |
7 |
|
- cash - |
| |
11/15/10 |
12/20/10 |
35 |
|
|
|
Richemont |
100 |
471 |
|
55.873 |
56.949 |
|
1.076 |
2 |
26,843 |
22 |
|
| 12/20/10 |
2/14/11 |
56 |
|
- cash - |
| |
2/14/11 |
2/21/11 |
7 |
|
|
|
Swiss Life |
100 |
166 |
|
161.618 |
164.978 |
|
3.360 |
2 |
27,400 |
192 |
|
| 2/21/11 |
3/07/11 |
14 |
|
- cash - |
| |
3/07/11 |
4/11/11 |
35 |
|
|
|
Swiss Life |
100 |
162 |
|
168.808 |
178.365 |
|
9.557 |
6 |
28,949 |
78 |
|
| 4/11/11 |
4/25/11 |
14 |
|
- cash - |
| |
4/25/11 |
5/30/11 |
35 |
|
|
|
Swiss Life |
100 |
163 |
|
176.581 |
165.711 |
|
-10.870 |
-6 |
27,177 |
-48 |
|
| 5/30/11 |
6/04/12 |
371 |
|
- cash - |
| |
6/04/12 |
11/19/12 |
168 |
|
|
|
ams-OSRAM |
100 |
2,069 |
|
13.132 |
21.099 |
|
7.967 |
61 |
43,660 |
180 |
|
| 11/19/12 |
11/26/12 |
7 |
|
- cash - |
| |
11/26/12 |
4/15/13 |
140 |
|
|
|
ams-OSRAM |
100 |
2,138 |
|
20.420 |
21.735 |
|
1.315 |
6 |
46,471 |
18 |
|
| |
4/15/13 |
3/17/14 |
336 |
|
|
|
Lonza |
100 |
717 |
|
64.741 |
107.067 |
|
42.326 |
65 |
76,819 |
73 |
|
| 3/17/14 |
3/24/14 |
7 |
|
- cash - |
| |
3/24/14 |
8/18/14 |
147 |
|
|
|
Logitech |
100 |
5,147 |
|
14.922 |
14.283 |
|
-0.639 |
-4 |
73,529 |
-10 |
|
| 8/18/14 |
8/25/14 |
7 |
|
- cash - |
| |
8/25/14 |
10/13/14 |
49 |
|
|
|
ams-OSRAM |
100 |
2,025 |
|
36.308 |
32.785 |
|
-3.523 |
-10 |
66,395 |
-53 |
|
| 10/13/14 |
11/03/14 |
21 |
|
- cash - |
| |
11/03/14 |
12/15/14 |
42 |
|
|
|
ams-OSRAM |
100 |
1,871 |
|
35.477 |
35.741 |
|
0.264 |
1 |
66,889 |
7 |
|
| 12/15/14 |
12/22/14 |
7 |
|
- cash - |
| |
12/22/14 |
1/05/15 |
14 |
|
|
|
ams-OSRAM |
100 |
1,820 |
|
36.736 |
36.245 |
|
-0.491 |
-1 |
65,995 |
-30 |
|
| 1/05/15 |
1/12/15 |
7 |
|
- cash - |
| |
1/12/15 |
1/19/15 |
7 |
|
|
|
ams-OSRAM |
100 |
1,765 |
|
37.387 |
37.975 |
|
0.588 |
2 |
67,033 |
125 |
|
| 1/19/15 |
2/23/15 |
35 |
|
- cash - |
| |
2/23/15 |
6/15/15 |
112 |
|
|
|
ams-OSRAM |
100 |
1,536 |
|
43.640 |
44.973 |
|
1.333 |
3 |
69,080 |
10 |
|
| 6/15/15 |
7/13/15 |
28 |
|
- cash - |
| |
7/13/15 |
7/20/15 |
7 |
|
|
|
Julius Bär |
100 |
1,216 |
|
56.778 |
55.344 |
|
-1.434 |
-3 |
67,336 |
-74 |
|
| 7/20/15 |
8/03/15 |
14 |
|
- cash - |
| |
8/03/15 |
8/24/15 |
21 |
|
|
|
UBS |
100 |
2,913 |
|
23.113 |
20.711 |
|
-2.403 |
-10 |
60,337 |
-85 |
|
| L/S | date buy | date sell | days | | instrument | spl | pieces | | prc buy | prc sell | | prc diff | d % | asset | yield | |
| 8/24/15 |
11/16/15 |
84 |
|
- cash - |
| |
11/16/15 |
12/14/15 |
28 |
|
|
|
Temenos |
100 |
1,290 |
|
46.745 |
49.982 |
|
3.237 |
7 |
64,513 |
139 |
|
| 12/14/15 |
12/05/16 |
357 |
|
- cash - |
| |
12/05/16 |
1/02/17 |
28 |
|
|
|
Logitech |
100 |
2,622 |
|
24.600 |
24.961 |
|
0.361 |
1 |
65,460 |
21 |
|
| 1/02/17 |
1/09/17 |
7 |
|
- cash - |
| |
1/09/17 |
10/09/17 |
273 |
|
|
|
Logitech |
100 |
2,579 |
|
25.373 |
36.025 |
|
10.652 |
42 |
92,930 |
60 |
|
| |
10/09/17 |
3/05/18 |
147 |
|
|
|
ams-OSRAM |
100 |
1,256 |
|
73.979 |
117.648 |
|
43.669 |
59 |
147,779 |
216 |
|
| 3/05/18 |
5/07/18 |
63 |
|
- cash - |
| |
5/07/18 |
5/14/18 |
7 |
|
|
|
Temenos |
100 |
1,130 |
|
130.705 |
134.958 |
|
4.253 |
3 |
152,585 |
431 |
|
| 5/14/18 |
4/29/19 |
350 |
|
- cash - |
| |
4/29/19 |
5/06/19 |
7 |
|
|
|
Swiss Life |
100 |
326 |
|
468.002 |
448.946 |
|
-19.056 |
-4 |
146,372 |
-89 |
|
| 5/06/19 |
8/12/19 |
98 |
|
- cash - |
| |
8/12/19 |
12/23/19 |
133 |
|
|
|
ams-OSRAM |
100 |
2,951 |
|
49.596 |
40.937 |
|
-8.659 |
-17 |
120,820 |
-41 |
|
| |
12/23/19 |
2/24/20 |
63 |
|
|
|
VAT |
100 |
727 |
|
166.042 |
143.954 |
|
-22.088 |
-13 |
104,763 |
-56 |
|
| |
2/24/20 |
3/02/20 |
7 |
|
|
|
Lonza |
100 |
250 |
|
417.504 |
408.973 |
|
-8.531 |
-2 |
102,630 |
-66 |
|
| 3/02/20 |
12/28/20 |
301 |
|
- cash - |
| |
12/28/20 |
8/02/21 |
217 |
|
|
|
Logitech |
100 |
1,086 |
|
94.423 |
108.864 |
|
14.441 |
15 |
118,313 |
27 |
|
| |
8/02/21 |
1/24/22 |
175 |
|
|
|
VAT |
100 |
298 |
|
396.774 |
388.486 |
|
-8.287 |
-2 |
115,844 |
-4 |
|
| 1/24/22 |
4/17/23 |
448 |
|
- cash - |
| |
4/17/23 |
4/24/23 |
7 |
|
|
|
Richemont |
100 |
711 |
|
162.752 |
171.052 |
|
8.301 |
5 |
121,746 |
1,238 |
|
| 4/24/23 |
5/01/23 |
7 |
|
- cash - |
| |
5/01/23 |
5/29/23 |
28 |
|
|
|
Richemont |
100 |
741 |
|
164.151 |
165.672 |
|
1.521 |
1 |
122,873 |
13 |
|
| 5/29/23 |
7/17/23 |
49 |
|
- cash - |
| |
7/17/23 |
9/11/23 |
56 |
|
|
|
VAT |
100 |
282 |
|
435.096 |
380.610 |
|
-54.486 |
-13 |
107,508 |
-58 |
|
| 9/11/23 |
10/16/23 |
35 |
|
- cash - |
| |
10/16/23 |
10/23/23 |
7 |
|
|
|
UBS |
100 |
4,312 |
|
24.932 |
23.832 |
|
-1.101 |
-4 |
102,762 |
-91 |
|
| 10/23/23 |
6/13/26 |
964 |
|
- cash - |
| accum | 1/02/06 |
10/23/23 | 3318 |
days out of 7467 invested (44%) |
928 |
102,762 |
29 |
|
Instrument Related Contribution
| instrument | L/S | date buy | date sell | days | prc buy | prc sell | | prc diff | d % | | | total |
| ams-OSRAM | long | 6/07/10 | 7/05/10 | 28 | 6.48 | 6.63 | | 0.15 | 2.38 | | | |
| | | 8/02/10 | 8/09/10 | 7 | 6.81 | 7.24 | | 0.43 | 6.27 | | | |
| | | 6/04/12 | 11/19/12 | 168 | 13.13 | 21.10 | | 7.97 | 60.67 | | | |
| | | 11/26/12 | 4/15/13 | 140 | 20.42 | 21.73 | | 1.31 | 6.44 | | | |
| | | 8/25/14 | 10/13/14 | 49 | 36.31 | 32.79 | | -3.52 | -9.70 | | | |
| | | 11/03/14 | 12/15/14 | 42 | 35.48 | 35.74 | | 0.26 | 0.74 | | | |
| | | 12/22/14 | 1/05/15 | 14 | 36.74 | 36.24 | | -0.49 | -1.34 | | | |
| | | 1/12/15 | 1/19/15 | 7 | 37.39 | 37.98 | | 0.59 | 1.57 | | | |
| | | 2/23/15 | 6/15/15 | 112 | 43.64 | 44.97 | | 1.33 | 3.05 | | | |
| | | 10/09/17 | 3/05/18 | 147 | 73.98 | 117.65 | | 43.67 | 59.03 | | | |
| | | 8/12/19 | 12/23/19 | 133 | 49.60 | 40.94 | | -8.66 | -17.46 | | | 129.44 |
| ABB | | 1/02/06 | 8/20/07 | 595 | 9.97 | 22.02 | | 12.05 | 120.84 | | | |
| | | 10/08/07 | 10/22/07 | 14 | 26.99 | 27.09 | | 0.10 | 0.37 | | | |
| | | 10/29/07 | 11/05/07 | 7 | 30.07 | 30.91 | | 0.84 | 2.80 | | | 127.87 |
| Lonza | | 4/15/13 | 3/17/14 | 336 | 64.74 | 107.07 | | 42.33 | 65.38 | | | |
| | | 2/24/20 | 3/02/20 | 7 | 417.50 | 408.97 | | -8.53 | -2.04 | | | 62.00 |
| Logitech | | 3/24/14 | 8/18/14 | 147 | 14.92 | 14.28 | | -0.64 | -4.28 | | | |
| | | 12/05/16 | 1/02/17 | 28 | 24.60 | 24.96 | | 0.36 | 1.47 | | | |
| | | 1/09/17 | 10/09/17 | 273 | 25.37 | 36.02 | | 10.65 | 41.98 | | | |
| | | 12/28/20 | 8/02/21 | 217 | 94.42 | 108.86 | | 14.44 | 15.29 | | | 58.98 |
| Richemont | | 10/11/10 | 11/08/10 | 28 | 50.09 | 55.35 | | 5.25 | 10.48 | | | |
| | | 11/15/10 | 12/20/10 | 35 | 55.87 | 56.95 | | 1.08 | 1.93 | | | |
| | | 4/17/23 | 4/24/23 | 7 | 162.75 | 171.05 | | 8.30 | 5.10 | | | |
| | | 5/01/23 | 5/29/23 | 28 | 164.15 | 165.67 | | 1.52 | 0.93 | | | 19.45 |
| Temenos | | 9/14/09 | 6/07/10 | 266 | 22.58 | 22.11 | | -0.47 | -2.09 | | | |
| | | 11/16/15 | 12/14/15 | 28 | 46.75 | 49.98 | | 3.24 | 6.92 | | | |
| | | 5/07/18 | 5/14/18 | 7 | 130.71 | 134.96 | | 4.25 | 3.25 | | | 8.10 |
| instrument | L/S | date buy | date sell | days | prc buy | prc sell | | prc diff | d % | | | total |
| Schindler | | 9/06/10 | 9/13/10 | 7 | 100.73 | 99.74 | | -0.99 | -0.98 | | | |
| | | 9/20/10 | 10/04/10 | 14 | 104.48 | 106.50 | | 2.01 | 1.93 | | | 0.93 |
| Julius Bär | | 7/13/15 | 7/20/15 | 7 | 56.78 | 55.34 | | -1.43 | -2.53 | | | -2.53 |
| Swiss Re | | 8/24/09 | 9/07/09 | 14 | 45.26 | 44.07 | | -1.19 | -2.62 | | | -2.62 |
| Swiss Life | | 2/14/11 | 2/21/11 | 7 | 161.62 | 164.98 | | 3.36 | 2.08 | | | |
| | | 3/07/11 | 4/11/11 | 35 | 168.81 | 178.36 | | 9.56 | 5.66 | | | |
| | | 4/25/11 | 5/30/11 | 35 | 176.58 | 165.71 | | -10.87 | -6.16 | | | |
| | | 4/29/19 | 5/06/19 | 7 | 468.00 | 448.95 | | -19.06 | -4.07 | | | -2.90 |
| UBS | | 8/03/15 | 8/24/15 | 21 | 23.11 | 20.71 | | -2.40 | -10.39 | | | |
| | | 10/16/23 | 10/23/23 | 7 | 24.93 | 23.83 | | -1.10 | -4.41 | | | -14.35 |
| VAT | | 12/23/19 | 2/24/20 | 63 | 166.04 | 143.95 | | -22.09 | -13.30 | | | |
| | | 8/02/21 | 1/24/22 | 175 | 396.77 | 388.49 | | -8.29 | -2.09 | | | |
| | | 7/17/23 | 9/11/23 | 56 | 435.10 | 380.61 | | -54.49 | -12.52 | | | -25.74 |
Annotations
| 4/12/23 | SGS | | | stock split 1:25 (twentyfive for one) |
| 4/20/22 | Straumann | | | stock split 1:10 (ten for one) |
| 11/13/18 | SLI | | | ams and Temenos replaced Aryzta and Bâloise |
| 8/13/18 | SLI | | | Logitech replaced Lindt & Sprüngli |
| 6/19/18 | Sika | | | stock split 1:60 (sixty for one) |
| 5/31/17 | SLI | | | Lindt & Sprüngli and Partners Group replace Actelion and Syngenta |
| 4/05/16 | SLI | | | Transocean was replaced by Dufry |
| 9/15/15 | SLI | | | complete analysis |
|
|