Assessment - Dow Jones Industrial Avgerage in Japanese yen - 7/01/24 - RS = 25
⇐
⇓ freshest
Δday
7/01/24
⇓ 1/08/24
prc diff
⇓
⇓
DJIA
6,359,085.870
8/12/24
-0.36
6,328,790.659
0.48
5,423,015.069
905,775.590
16.70
16.83
S
UnitedHealth
91,336.424
8/12/24
1.17
79,922.805
14.28
77,211.370
2,711.435
3.51
6.49
L
Walmart
11,100.165
8/12/24
1.10
10,903.044
1.81
7,591.329
3,311.715
43.62
31.73
L
Apple
35,147.291
8/12/24
0.71
35,021.263
0.36
26,704.208
8,317.055
31.15
28.50
S
McDonald´s
43,537.853
8/12/24
0.58
40,391.998
7.79
42,007.751
-1,615.753
-3.85
-2.49
Nike
12,059.917
8/12/24
0.40
12,413.765
-2.85
14,912.104
-2,498.339
-16.75
-17.65
JP Morgan Chase
33,315.037
8/12/24
0.19
33,195.472
0.36
24,755.647
8,439.825
34.09
35.41
Microsoft
65,730.104
8/12/24
0.19
73,795.901
-10.93
53,922.180
19,873.721
36.86
33.91
Visa
41,991.585
8/12/24
0.05
42,532.860
-1.27
37,782.511
4,750.348
12.57
11.55
Chevron
23,431.528
8/12/24
0.02
25,289.634
-7.35
21,514.761
3,774.872
17.55
9.44
Walt Disney
13,887.325
8/12/24
-0.30
15,840.760
-12.33
13,175.093
2,665.667
20.23
12.48
American Express
38,301.225
8/12/24
-0.34
37,777.724
1.39
27,229.485
10,548.239
38.74
38.32
S
Johnson & Johnson
25,832.524
8/12/24
-0.46
23,660.963
9.18
23,246.016
414.947
1.79
1.55
S
salesforce.com
40,605.277
8/12/24
-0.48
41,396.991
-1.91
37,542.179
3,854.812
10.27
14.34
Verizon
6,548.613
8/12/24
-0.54
6,744.118
-2.90
5,770.849
973.269
16.87
22.98
L
3M
19,931.825
8/12/24
-0.65
16,256.006
22.61
15,666.200
589.806
3.76
11.10
Caterpillar
54,293.864
8/12/24
-0.66
53,170.922
2.11
42,058.120
11,112.802
26.42
23.05
L
Honeywell
31,796.237
8/12/24
-0.73
34,084.132
-6.71
29,165.094
4,919.038
16.87
16.73
L
Coca-Cola
11,014.531
8/12/24
-0.74
10,224.432
7.73
8,650.517
1,573.914
18.19
15.66
L
Amgen
51,703.826
8/12/24
-0.77
50,251.272
2.89
44,739.191
5,512.081
12.32
24.07
Home Depot
55,874.063
8/12/24
-0.81
54,319.716
2.86
50,071.110
4,248.607
8.49
10.46
Dow
8,437.418
8/12/24
-0.84
8,503.664
-0.78
7,926.643
577.021
7.28
5.75
Merck (MSD)
18,335.469
8/12/24
-0.93
20,665.373
-11.27
16,892.326
3,773.047
22.34
21.56
L
Goldman Sachs
78,444.398
8/12/24
-0.97
74,915.612
4.71
55,961.405
18,954.207
33.87
38.53
IBM
30,615.128
8/12/24
-1.03
28,291.687
8.21
23,189.891
5,101.797
22.00
19.86
⇓ freshest
Δday
7/01/24
⇓ 1/08/24
prc diff
⇓
⇓
Travelers Companies
33,887.011
8/12/24
-1.29
32,794.767
3.33
27,675.610
5,119.157
18.50
17.42
S
Cisco Systems
7,248.230
8/12/24
-1.34
7,678.018
-5.60
7,261.772
416.247
5.73
2.13
S
Intel
3,128.081
8/12/24
-1.78
4,982.956
-37.22
6,972.510
-1,989.553
-28.53
-10.97
L
Procter & Gamble
26,952.235
8/12/24
-2.19
26,291.396
2.51
21,398.193
4,893.202
22.87
14.61
Boeing
26,519.215
8/12/24
-2.25
30,165.951
-12.09
32,955.721
-2,789.770
-8.47
-0.18
S
Walgreens Boots
1,648.059
8/12/24
-4.49
1,871.032
-11.92
3,688.450
-1,817.418
-49.27
-42.29
DJIA - 30 out of 30 instruments rated - 7/01/24 / 1/08/24 - 25 did rise, Market-Ratio(25) in JPY = 83.33 % Stock Exchange Currency: USD $ Dollar
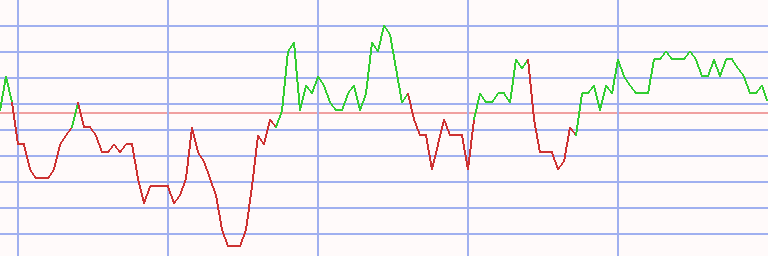
Technical Chart
Transactions Dow Jones Industrial Avgerage in Japanese yen * L25 - 56 ex 5 (1)
⇐ L/S date buy date sell days instrument spl pieces prc buy prc sell prc diff d % asset yield long
1/02/06
1/16/06
14
salesforce.com
100
9
1,008.168
1,112.979
104.811
10
10,943
1,218
1/16/06 1/23/06 7 - cash -
1/23/06
1/30/06
7
salesforce.com
100
9
1,150.158
1,250.585
100.426
9
11,847
7,765
1/30/06 2/13/06 14 - cash -
2/13/06
5/15/06
91
salesforce.com
100
11
1,009.441
857.709
-151.732
-15
10,178
-48
5/15/06 8/28/06 105 - cash -
8/28/06
9/11/06
14
Merck (MSD)
100
2
4,802.707
4,828.135
25.428
1
10,229
15
9/11/06 9/18/06 7 - cash -
9/18/06
12/11/06
84
Merck (MSD)
100
2
4,793.726
5,119.333
325.607
7
10,880
33
12/11/06
3/05/07
84
Goldman Sachs
100
0
23,557.542
22,191.641
-1,365.901
-6
10,880
0
3/05/07
4/23/07
49
salesforce.com
100
8
1,213.824
1,225.104
11.279
1
10,970
7
4/23/07
5/21/07
28
Goldman Sachs
100
0
26,397.440
27,764.165
1,366.724
5
10,970
0
5/21/07
7/30/07
70
Apple
100
22
484.386
599.045
114.658
24
13,493
203
7/30/07 8/06/07 7 - cash -
8/06/07
8/13/07
7
Apple
100
23
570.169
540.325
-29.844
-5
12,806
-94
8/13/07 8/20/07 7 - cash -
8/20/07
11/12/07
84
Apple
100
25
499.116
607.786
108.670
22
15,523
135
11/12/07 12/10/07 28 - cash -
12/10/07
12/31/07
21
Apple
100
20
774.663
794.532
19.869
3
15,921
55
12/31/07 8/11/08 224 - cash -
8/11/08
8/18/08
7
Amgen
100
2
7,054.494
7,128.115
73.621
1
16,068
72
8/18/08 9/01/08 14 - cash -
9/01/08
9/08/08
7
Amgen
100
2
6,800.918
6,441.745
-359.173
-5
15,349
-94
9/08/08 4/20/09 224 - cash -
4/20/09
4/27/09
7
Home Depot
100
6
2,493.985
2,514.906
20.920
1
15,475
55
4/27/09 5/04/09 7 - cash -
5/04/09
6/29/09
56
Goldman Sachs
100
1
13,303.778
14,217.781
914.003
7
16,389
54
6/29/09 7/13/09 14 - cash -
7/13/09
12/07/09
147
Goldman Sachs
100
1
13,833.145
14,833.294
1,000.149
7
17,389
19
12/07/09
5/10/10
154
American Express
100
4
3,567.776
3,946.769
378.992
11
18,905
27
5/10/10
5/17/10
7
salesforce.com
100
9
1,957.584
1,970.420
12.836
1
19,021
41
5/17/10 7/26/10 70 - cash -
7/26/10
8/09/10
14
salesforce.com
100
8
2,188.547
2,224.428
35.882
2
19,308
53
8/09/10 10/25/10 77 - cash -
10/25/10
3/07/11
133
salesforce.com
100
8
2,289.019
2,634.441
345.421
15
22,071
47
3/07/11
7/25/11
140
Caterpillar
100
2
8,406.669
8,295.656
-111.012
-1
21,849
-3
7/25/11
8/01/11
7
UnitedHealth
100
5
4,053.613
3,687.893
-365.720
-9
20,020
-99
8/01/11 12/26/11 147 - cash -
12/26/11
7/16/12
203
Visa
100
10
1,990.070
2,516.845
526.776
26
25,288
53
7/16/12 7/23/12 7 - cash -
7/23/12
9/03/12
42
Apple
100
14
1,692.541
1,889.374
196.833
12
28,044
160
L/S date buy date sell days instrument spl pieces prc buy prc sell prc diff d % asset yield
9/03/12 9/17/12 14 - cash -
9/17/12
9/24/12
7
Apple
100
14
1,959.455
1,928.253
-31.202
-2
27,607
-57
9/24/12 10/01/12 7 - cash -
10/01/12
10/29/12
28
Home Depot
100
5
4,720.004
4,888.387
168.384
4
28,449
58
10/29/12 11/05/12 7 - cash -
11/05/12
2/25/13
112
Home Depot
100
5
5,017.807
5,970.906
953.099
19
33,214
76
2/25/13
4/22/13
56
Goldman Sachs
100
2
13,792.308
13,884.656
92.348
1
33,399
4
4/22/13
7/01/13
70
Walgreens Boots
100
6
4,948.001
4,395.829
-552.172
-11
30,086
-46
7/01/13
1/27/14
210
Boeing
100
2
10,235.123
14,102.835
3,867.712
38
37,822
75
1/27/14 2/10/14 14 - cash -
2/10/14
4/07/14
56
salesforce.com
100
6
6,238.844
5,562.617
-676.227
-11
33,764
-53
4/07/14
8/11/14
126
Walgreens Boots
100
5
6,709.772
6,335.495
-374.277
-6
31,893
-15
8/11/14
10/13/14
63
Intel
100
9
3,374.706
3,366.193
-8.513
0
31,816
-1
10/13/14 10/20/14 7 - cash -
10/20/14
1/05/15
77
Apple
100
11
2,667.457
3,169.157
501.699
19
37,335
126
1/05/15
2/09/15
35
Amgen
100
1
18,849.695
17,784.800
-1,064.896
-6
36,270
-45
2/09/15
5/25/15
105
Apple
100
10
3,548.424
4,028.603
480.179
14
41,072
55
5/25/15 6/08/15 14 - cash -
6/08/15
6/15/15
7
UnitedHealth
100
2
14,556.436
14,686.362
129.926
1
41,332
59
6/15/15 7/20/15 35 - cash -
7/20/15
8/10/15
21
Walgreens Boots
100
3
11,891.488
11,707.091
-184.396
-2
40,778
-24
8/10/15 11/02/15 84 - cash -
11/02/15
11/09/15
7
Nike
100
5
7,920.529
8,035.140
114.610
1
41,351
112
11/09/15 12/07/15 28 - cash -
12/07/15
12/14/15
7
Nike
100
5
8,117.296
7,743.144
-374.153
-5
39,481
-91
12/14/15 2/22/16 70 - cash -
2/22/16
4/25/16
63
McDonald´s
100
2
13,203.472
14,179.991
976.519
7
41,434
51
4/25/16 5/30/16 35 - cash -
5/30/16
6/20/16
21
salesforce.com
100
4
9,304.827
8,438.912
-865.914
-9
37,970
-82
6/20/16 7/04/16 14 - cash -
7/04/16
8/22/16
49
Johnson & Johnson
100
3
12,436.765
11,949.722
-487.043
-4
36,509
-26
8/22/16
10/17/16
56
Merck (MSD)
100
5
6,374.589
6,391.089
16.500
0
36,591
2
10/17/16 10/24/16 7 - cash -
10/24/16
11/28/16
35
Caterpillar
100
4
9,068.241
10,302.180
1,233.940
14
41,527
278
11/28/16 12/05/16 7 - cash -
12/05/16
1/09/17
35
Goldman Sachs
100
1
26,378.659
28,127.140
1,748.480
7
43,276
95
1/09/17 1/23/17 14 - cash -
1/23/17
5/22/17
119
Goldman Sachs
100
1
26,219.411
24,043.446
-2,175.964
-8
41,100
-23
5/22/17
7/03/17
42
Apple
100
9
4,284.847
4,071.074
-213.773
-5
39,176
-36
7/03/17
5/07/18
308
Boeing
100
1
22,535.875
37,144.905
14,609.030
65
53,785
81
L/S date buy date sell days instrument spl pieces prc buy prc sell prc diff d % asset yield
5/07/18 5/14/18 7 - cash -
5/14/18
5/28/18
14
Intel
100
8
6,020.971
6,061.811
40.839
1
54,112
19
5/28/18 7/30/18 63 - cash -
7/30/18
8/13/18
14
salesforce.com
100
3
15,309.060
15,997.978
688.918
5
56,178
215
8/13/18 8/20/18 7 - cash -
8/20/18
10/15/18
56
Nike
100
6
9,057.561
8,381.304
-676.256
-7
52,121
-40
10/15/18
11/05/18
21
Apple
100
8
6,073.344
5,701.334
-372.010
-6
49,145
-67
11/05/18
12/10/18
35
Merck (MSD)
100
5
8,271.869
8,761.475
489.606
6
51,593
82
12/10/18 2/04/19 56 - cash -
2/04/19
2/18/19
14
Procter & Gamble
100
4
10,772.048
10,885.822
113.774
1
52,048
32
2/18/19 2/25/19 7 - cash -
2/25/19
3/11/19
14
Boeing
100
1
47,437.980
48,308.073
870.092
2
52,918
61
3/11/19 4/08/19 28 - cash -
4/08/19
10/21/19
196
Procter & Gamble
100
4
11,697.147
12,925.194
1,228.047
10
57,830
20
10/21/19
3/02/20
133
Apple
100
8
6,526.365
8,061.343
1,534.977
24
70,110
79
3/02/20 8/24/20 175 - cash -
8/24/20
2/22/21
182
Apple
100
5
13,320.392
13,232.257
-88.135
-1
69,669
-1
2/22/21
7/05/21
133
Caterpillar
100
3
22,900.206
24,129.988
1,229.782
5
73,359
15
7/05/21
9/20/21
77
Goldman Sachs
100
1
41,460.674
41,353.384
-107.290
0
73,251
-1
9/20/21 9/27/21 7 - cash -
9/27/21
10/04/21
7
Goldman Sachs
100
1
44,363.361
41,467.631
-2,895.729
-7
70,356
-97
10/04/21 10/11/21 7 - cash -
10/11/21
11/01/21
21
Goldman Sachs
100
1
43,667.797
47,557.920
3,890.123
9
74,246
341
11/01/21 11/08/21 7 - cash -
11/08/21
11/15/21
7
Microsoft
100
1
38,137.205
38,311.755
174.550
0
74,420
27
11/15/21 12/27/21 42 - cash -
12/27/21
1/24/22
28
Apple
100
3
20,707.979
18,377.904
-2,330.074
-11
67,430
-79
1/24/22 4/04/22 70 - cash -
4/04/22
4/11/22
7
Chevron
100
3
20,167.776
20,770.860
603.084
3
69,239
365
4/11/22 11/28/22 231 - cash -
11/28/22
5/08/23
161
Merck (MSD)
100
4
15,056.727
15,973.431
916.704
6
72,906
14
5/08/23 7/24/23 77 - cash -
7/24/23
9/25/23
63
salesforce.com
100
2
31,878.649
30,697.974
-1,180.675
-4
70,545
-20
9/25/23 11/20/23 56 - cash -
11/20/23
2/05/24
77
Intel
100
10
6,635.533
6,353.011
-282.522
-4
67,720
-19
2/05/24
4/15/24
70
salesforce.com
100
1
42,795.560
42,072.119
-723.441
-2
66,996
-9
4/15/24
6/10/24
56
Caterpillar
100
1
56,102.840
51,690.091
-4,412.749
-8
62,583
-41
6/10/24
8/12/24
63
American Express
100
1
36,451.699
38,301.225
1,849.525
5
64,433
33
accum 1/02/06
8/12/24 5297
days out of 7453 invested (71%)
544
64,433
14
Instrument Related Contribution
instrument L/S date buy date sell days prc buy prc sell prc diff d % total Boeing long 7/01/13 1/27/14 210 10,235.12 14,102.84 3,867.71 37.79 7/03/17 5/07/18 308 22,535.87 37,144.90 14,609.03 64.83 2/25/19 3/11/19 14 47,437.98 48,308.07 870.09 1.83 131.28 Apple 5/21/07 7/30/07 70 484.39 599.04 114.66 23.67 8/06/07 8/13/07 7 570.17 540.32 -29.84 -5.23 8/20/07 11/12/07 84 499.12 607.79 108.67 21.77 12/10/07 12/31/07 21 774.66 794.53 19.87 2.56 7/23/12 9/03/12 42 1,692.54 1,889.37 196.83 11.63 9/17/12 9/24/12 7 1,959.45 1,928.25 -31.20 -1.59 10/20/14 1/05/15 77 2,667.46 3,169.16 501.70 18.81 2/09/15 5/25/15 105 3,548.42 4,028.60 480.18 13.53 5/22/17 7/03/17 42 4,284.85 4,071.07 -213.77 -4.99 10/15/18 11/05/18 21 6,073.34 5,701.33 -372.01 -6.13 10/21/19 3/02/20 133 6,526.37 8,061.34 1,534.98 23.52 8/24/20 2/22/21 182 13,320.39 13,232.26 -88.13 -0.66 12/27/21 1/24/22 28 20,707.98 18,377.90 -2,330.07 -11.25 110.66 Visa 12/26/11 7/16/12 203 1,990.07 2,516.85 526.78 26.47 26.47 Home Depot 4/20/09 4/27/09 7 2,493.99 2,514.91 20.92 0.84 10/01/12 10/29/12 28 4,720.00 4,888.39 168.38 3.57 11/05/12 2/25/13 112 5,017.81 5,970.91 953.10 18.99 24.27 Merck (MSD) 8/28/06 9/11/06 14 4,802.71 4,828.13 25.43 0.53 9/18/06 12/11/06 84 4,793.73 5,119.33 325.61 6.79 8/22/16 10/17/16 56 6,374.59 6,391.09 16.50 0.26 11/05/18 12/10/18 35 8,271.87 8,761.48 489.61 5.92 11/28/22 5/08/23 161 15,056.73 15,973.43 916.70 6.09 20.95 instrument L/S date buy date sell days prc buy prc sell prc diff d % total American Express 12/07/09 5/10/10 154 3,567.78 3,946.77 378.99 10.62 6/10/24 8/12/24 63 36,451.70 38,301.22 1,849.53 5.07 16.24 Goldman Sachs 12/11/06 3/05/07 84 23,557.54 22,191.64 -1,365.90 -5.80 4/23/07 5/21/07 28 26,397.44 27,764.16 1,366.72 5.18 5/04/09 6/29/09 56 13,303.78 14,217.78 914.00 6.87 7/13/09 12/07/09 147 13,833.14 14,833.29 1,000.15 7.23 2/25/13 4/22/13 56 13,792.31 13,884.66 92.35 0.67 12/05/16 1/09/17 35 26,378.66 28,127.14 1,748.48 6.63 1/23/17 5/22/17 119 26,219.41 24,043.45 -2,175.96 -8.30 7/05/21 9/20/21 77 41,460.67 41,353.38 -107.29 -0.26 9/27/21 10/04/21 7 44,363.36 41,467.63 -2,895.73 -6.53 10/11/21 11/01/21 21 43,667.80 47,557.92 3,890.12 8.91 13.48 Procter & Gamble 2/04/19 2/18/19 14 10,772.05 10,885.82 113.77 1.06 4/08/19 10/21/19 196 11,697.15 12,925.19 1,228.05 10.50 11.67 Caterpillar 3/07/11 7/25/11 140 8,406.67 8,295.66 -111.01 -1.32 10/24/16 11/28/16 35 9,068.24 10,302.18 1,233.94 13.61 2/22/21 7/05/21 133 22,900.21 24,129.99 1,229.78 5.37 4/15/24 6/10/24 56 56,102.84 51,690.09 -4,412.75 -7.87 8.84 McDonald´s 2/22/16 4/25/16 63 13,203.47 14,179.99 976.52 7.40 7.40 Chevron 4/04/22 4/11/22 7 20,167.78 20,770.86 603.08 2.99 2.99 Microsoft 11/08/21 11/15/21 7 38,137.21 38,311.76 174.55 0.46 0.46 salesforce.com 1/02/06 1/16/06 14 1,008.17 1,112.98 104.81 10.40 1/23/06 1/30/06 7 1,150.16 1,250.58 100.43 8.73 2/13/06 5/15/06 91 1,009.44 857.71 -151.73 -15.03 3/05/07 4/23/07 49 1,213.82 1,225.10 11.28 0.93 5/10/10 5/17/10 7 1,957.58 1,970.42 12.84 0.66 7/26/10 8/09/10 14 2,188.55 2,224.43 35.88 1.64 10/25/10 3/07/11 133 2,289.02 2,634.44 345.42 15.09 2/10/14 4/07/14 56 6,238.84 5,562.62 -676.23 -10.84 5/30/16 6/20/16 21 9,304.83 8,438.91 -865.91 -9.31 7/30/18 8/13/18 14 15,309.06 15,997.98 688.92 4.50 7/24/23 9/25/23 63 31,878.65 30,697.97 -1,180.67 -3.70 2/05/24 4/15/24 70 42,795.56 42,072.12 -723.44 -1.69 -3.04 instrument L/S date buy date sell days prc buy prc sell prc diff d % total Intel 8/11/14 10/13/14 63 3,374.71 3,366.19 -8.51 -0.25 5/14/18 5/28/18 14 6,020.97 6,061.81 40.84 0.68 11/20/23 2/05/24 77 6,635.53 6,353.01 -282.52 -4.26 -3.85 Johnson & Johnson 7/04/16 8/22/16 49 12,436.76 11,949.72 -487.04 -3.92 -3.92 UnitedHealth 7/25/11 8/01/11 7 4,053.61 3,687.89 -365.72 -9.02 6/08/15 6/15/15 7 14,556.44 14,686.36 129.93 0.89 -8.21 Amgen 8/11/08 8/18/08 7 7,054.49 7,128.12 73.62 1.04 9/01/08 9/08/08 7 6,800.92 6,441.75 -359.17 -5.28 1/05/15 2/09/15 35 18,849.70 17,784.80 -1,064.90 -5.65 -9.70 Nike 11/02/15 11/09/15 7 7,920.53 8,035.14 114.61 1.45 12/07/15 12/14/15 7 8,117.30 7,743.14 -374.15 -4.61 8/20/18 10/15/18 56 9,057.56 8,381.30 -676.26 -7.47 -10.45 Walgreens Boots 4/22/13 7/01/13 70 4,948.00 4,395.83 -552.17 -11.16 4/07/14 8/11/14 126 6,709.77 6,335.49 -374.28 -5.58 7/20/15 8/10/15 21 11,891.49 11,707.09 -184.40 -1.55 -17.42
Annotations
2/26/24 Walmart stock split 1:3 (three for one) 6/26/18 DJIA Walgreens Boots replaces General Electric 12/24/15 Nike stock split 1:2 (two for one) 7/08/15 DJIA The Dow Jones seems to be some kind of analysis and rule resistant. The analysis for exchanging 3/19/15 Visa forward stock split 1:4 (four for one) 3/18/15 DJIA Apple replaces AT&T 9/23/13 DJIA Goldman Sachs, Nike and Visa replace Alcoa, Bank of America and Hewlett-Packard
write an annotation