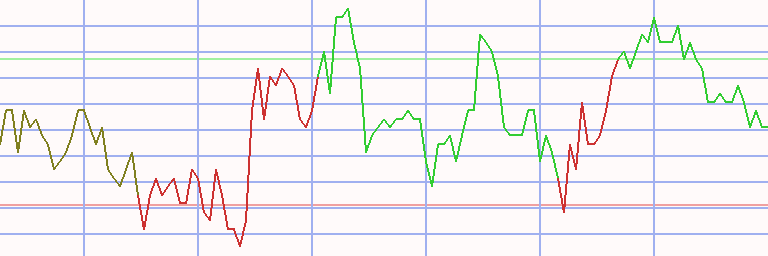
Assessment - Dow Jones Industrial Avgerage in Japanese yen - 7/01/24 - RS = 19
⇐
⇓ freshest
Δday
7/01/24
⇓ 2/19/24
prc diff
⇓
⇓
DJIA
6,359,085.870
8/12/24
-0.36
6,328,790.659
0.48
5,799,378.337
529,412.322
9.13
16.83
S
UnitedHealth
91,336.424
8/12/24
1.17
79,922.805
14.28
78,302.417
1,620.388
2.07
6.49
L
Walmart
11,100.165
8/12/24
1.10
10,903.044
1.81
8,525.618
2,377.427
27.89
31.73
L
Apple
35,147.291
8/12/24
0.71
35,021.263
0.36
27,370.940
7,650.324
27.95
28.50
S
McDonald´s
43,537.853
8/12/24
0.58
40,391.998
7.79
43,842.147
-3,450.149
-7.87
-2.49
Nike
12,059.917
8/12/24
0.40
12,413.765
-2.85
15,540.376
-3,126.611
-20.12
-17.65
JP Morgan Chase
33,315.037
8/12/24
0.19
33,195.472
0.36
26,878.500
6,316.972
23.50
35.41
Microsoft
65,730.104
8/12/24
0.19
73,795.901
-10.93
60,663.167
13,132.734
21.65
33.91
Visa
41,991.585
8/12/24
0.05
42,532.860
-1.27
41,821.343
711.517
1.70
11.55
Chevron
23,431.528
8/12/24
0.02
25,289.634
-7.35
23,215.229
2,074.405
8.94
9.44
Walt Disney
13,887.325
8/12/24
-0.30
15,840.760
-12.33
16,754.961
-914.201
-5.46
12.48
American Express
38,301.225
8/12/24
-0.34
37,777.724
1.39
31,912.495
5,865.229
18.38
38.32
S
Johnson & Johnson
25,832.524
8/12/24
-0.46
23,660.963
9.18
23,503.487
157.477
0.67
1.55
S
salesforce.com
40,605.277
8/12/24
-0.48
41,396.991
-1.91
43,496.839
-2,099.847
-4.83
14.34
Verizon
6,548.613
8/12/24
-0.54
6,744.118
-2.90
6,078.928
665.190
10.94
22.98
L
3M
19,931.825
8/12/24
-0.65
16,256.006
22.61
13,699.733
2,556.273
18.66
11.10
Caterpillar
54,293.864
8/12/24
-0.66
53,170.922
2.11
48,329.654
4,841.268
10.02
23.05
L
Honeywell
31,796.237
8/12/24
-0.73
34,084.132
-6.71
29,601.932
4,482.200
15.14
16.73
L
Coca-Cola
11,014.531
8/12/24
-0.74
10,224.432
7.73
8,916.462
1,307.970
14.67
15.66
L
Amgen
51,703.826
8/12/24
-0.77
50,251.272
2.89
42,593.032
7,658.240
17.98
24.07
Home Depot
55,874.063
8/12/24
-0.81
54,319.716
2.86
54,401.075
-81.359
-0.15
10.46
Dow
8,437.418
8/12/24
-0.84
8,503.664
-0.78
8,329.437
174.226
2.09
5.75
Merck (MSD)
18,335.469
8/12/24
-0.93
20,665.373
-11.27
19,185.631
1,479.742
7.71
21.56
L
Goldman Sachs
78,444.398
8/12/24
-0.97
74,915.612
4.71
57,717.537
17,198.076
29.80
38.53
IBM
30,615.128
8/12/24
-1.03
28,291.687
8.21
28,171.154
120.533
0.43
19.86
⇓ freshest
Δday
7/01/24
⇓ 2/19/24
prc diff
⇓
⇓
Travelers Companies
33,887.011
8/12/24
-1.29
32,794.767
3.33
32,658.661
136.106
0.42
17.42
S
Cisco Systems
7,248.230
8/12/24
-1.34
7,678.018
-5.60
7,272.494
405.524
5.58
2.13
S
Intel
3,128.081
8/12/24
-1.78
4,982.956
-37.22
6,532.333
-1,549.377
-23.72
-10.97
L
Procter & Gamble
26,952.235
8/12/24
-2.19
26,291.396
2.51
23,647.615
2,643.780
11.18
14.61
Boeing
26,519.215
8/12/24
-2.25
30,165.951
-12.09
30,610.833
-444.882
-1.45
-0.18
S
Walgreens Boots
1,648.059
8/12/24
-4.49
1,871.032
-11.92
3,299.947
-1,428.914
-43.30
-42.29
DJIA - 30 out of 30 instruments rated - 7/01/24 / 2/19/24 - 22 did rise, Market-Ratio(19) in JPY = 73.33 % Stock Exchange Currency: USD $ Dollar
Technical Chart
Transactions Dow Jones Industrial Avgerage in Japanese yen * S19 - 20/77 (1)
⇐ L/S date buy date sell days instrument spl pieces prc buy prc sell ps short prc diff d % asset yield
1/02/06 2/04/08 763 - cash -
short
2/04/08
6/29/09
511
American Express
100
1
5,077.337
2,284.593
11,284.004
6,206.667
122
16,207
77
6/29/09 8/23/10 420 - cash -
8/23/10
10/04/10
42
Microsoft
100
7
2,078.987
1,990.015
2,171.937
92.950
4
16,857
46
10/04/10 8/22/11 322 - cash -
8/22/11
12/19/11
119
Goldman Sachs
100
2
8,154.545
6,821.260
9,748.433
1,593.888
20
20,045
73
12/19/11 8/24/15 1344 - cash -
8/24/15
5/30/16
280
Chevron
100
2
8,541.157
11,334.526
5,747.787
-2,793.369
-33
14,458
-40
5/30/16 12/24/18 938 - cash -
12/24/18
4/22/19
119
Goldman Sachs
100
0
17,267.823
22,895.761
11,639.886
-5,627.938
-33
14,458
0
4/22/19 3/09/20 322 - cash -
3/09/20
7/20/20
133
Exxon Mobil
100
3
4,274.162
4,557.562
3,990.763
-283.400
-7
13,608
-17
7/20/20 6/20/22 700 - cash -
6/20/22
1/16/23
210
Walt Disney
100
1
12,737.151
12,786.800
12,687.502
-49.649
0
13,559
-1
1/16/23 10/30/23 287 - cash -
10/30/23
1/08/24
70
Walgreens Boots
100
4
3,144.016
3,688.450
2,599.582
-544.434
-17
11,381
-63
1/08/24 5/30/26 873 - cash -
accum 2/04/08
1/08/24 1484
days out of 7453 invested (20%)
14
11,381
3
Instrument Related Contribution
instrument L/S date buy date sell days prc buy prc sell ps short prc diff d % total American Express short 2/04/08 6/29/09 511 5,077.34 2,284.59 11,284.00 6,206.67 122.24 122.24 Microsoft 8/23/10 10/04/10 42 2,078.99 1,990.02 2,171.94 92.95 4.47 4.47 Walt Disney 6/20/22 1/16/23 210 12,737.15 12,786.80 12,687.50 -49.65 -0.39 -0.39 Exxon Mobil 3/09/20 7/20/20 133 4,274.16 4,557.56 3,990.76 -283.40 -6.63 -6.63 Walgreens Boots 10/30/23 1/08/24 70 3,144.02 3,688.45 2,599.58 -544.43 -17.32 -17.32 Goldman Sachs 8/22/11 12/19/11 119 8,154.54 6,821.26 9,748.43 1,593.89 19.55 12/24/18 4/22/19 119 17,267.82 22,895.76 11,639.89 -5,627.94 -32.59 -19.42 Chevron 8/24/15 5/30/16 280 8,541.16 11,334.53 5,747.79 -2,793.37 -32.70 -32.70
Annotations
2/26/24 Walmart stock split 1:3 (three for one) 6/26/18 DJIA Walgreens Boots replaces General Electric 12/24/15 Nike stock split 1:2 (two for one) 7/08/15 DJIA The Dow Jones seems to be some kind of analysis and rule resistant. The analysis for exchanging 3/19/15 Visa forward stock split 1:4 (four for one) 3/18/15 DJIA Apple replaces AT&T 9/23/13 DJIA Goldman Sachs, Nike and Visa replace Alcoa, Bank of America and Hewlett-Packard
write an annotation