| | Wed, Apr 1st, 2026, 7:27UTC |
| | |

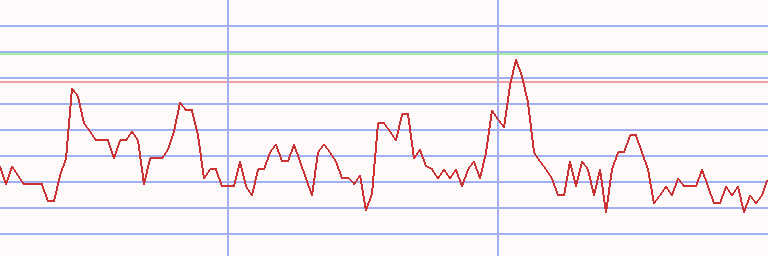
Assessment - Straits Times Index in Swiss Franc - 11/20/23 - RS = 45
⇐
| |
|
⇓instrument |
freshest |
⇓ Δday |
11/20/23 |
⇓ Δwk |
1/09/23 |
prc diff |
Δ45 |
|
⇓∅-RS |
| |  |
 |
 |
|
L |
 |
STI |
2,139.508 |
8/12/24 |
-0.81 |
2,057.641 |
|
2,288.067 |
-230.426 |
-10.07 |
|
-5.48 |
| | |
|
|
|
S |
|
Sembcorp Industries |
3.062 |
8/12/24 |
-2.53 |
3.339 |
|
2.374 |
0.965 |
40.66 |
|
13.97 |
| | |
|
|
|
L |
|
Yangzijiang Ship |
1.574 |
8/12/24 |
-4.03 |
0.972 |
|
0.838 |
0.135 |
16.07 |
|
4.57 |
| | |
|
|
|
|
|
Singapore Airlines |
3.902 |
8/12/24 |
0.34 |
4.126 |
|
3.855 |
0.271 |
7.03 |
|
-1.54 |
| | |
|
|
|
|
|
ST Engineering |
2.810 |
8/12/24 |
0.71 |
2.500 |
|
2.374 |
0.126 |
5.29 |
|
1.95 |
| | |
|
|
|
L |
|
Jardine Cycle & Carr |
17.213 |
8/12/24 |
1.21 |
19.614 |
|
19.339 |
0.275 |
1.42 |
|
-6.08 |
| | |
|
|
|
L |
|
Singapore Exchange |
6.461 |
8/12/24 |
-0.51 |
6.243 |
|
6.264 |
-0.022 |
-0.34 |
|
-0.97 |
| | |
|
|
|
|
|
Emperador |
0.284 |
8/12/24 |
|
0.341 |
|
0.346 |
-0.006 |
-1.60 |
|
-0.11 |
| | |
|
|
|
|
|
OCBC |
9.146 |
8/12/24 |
0.29 |
8.498 |
|
8.790 |
-0.293 |
-3.33 |
|
0.42 |
| | |
|
|
|
S |
|
Mapletree Industrial |
1.468 |
8/12/24 |
-0.89 |
1.501 |
|
1.564 |
-0.063 |
-4.04 |
|
-1.58 |
| | |
|
|
|
S |
|
CapitaLand Ascendas |
1.739 |
8/12/24 |
-0.75 |
1.838 |
|
1.917 |
-0.079 |
-4.12 |
|
-0.91 |
| | |
|
|
|
S |
|
Mapletree Logistics |
0.833 |
8/12/24 |
-0.79 |
1.045 |
|
1.128 |
-0.083 |
-7.39 |
|
-5.72 |
| | |
|
|
|
L |
|
SATS |
2.004 |
8/12/24 |
-0.98 |
1.812 |
|
1.966 |
-0.154 |
-7.83 |
|
0.74 |
| | |
|
|
|
S |
|
Genting |
0.526 |
8/12/24 |
-2.45 |
0.612 |
|
0.671 |
-0.060 |
-8.89 |
|
-4.84 |
| | |
|
|
|
|
|
CapitaLand ICT |
1.389 |
8/12/24 |
0.96 |
1.243 |
|
1.398 |
-0.155 |
-11.08 |
|
-5.30 |
| | |
|
|
|
S |
|
UOL |
3.511 |
8/12/24 |
-0.19 |
4.074 |
|
4.624 |
-0.550 |
-11.90 |
|
-8.55 |
| | |
|
|
|
L |
|
Singtel |
1.878 |
8/12/24 |
-2.74 |
1.528 |
|
1.737 |
-0.210 |
-12.07 |
|
-8.45 |
| | |
|
|
|
|
|
DBS Bank |
22.470 |
8/12/24 |
1.22 |
21.439 |
|
24.399 |
-2.960 |
-12.13 |
|
-4.08 |
| | |
|
|
|
S |
|
Frasers L&C Trust |
0.651 |
8/12/24 |
-1.50 |
0.727 |
|
0.831 |
-0.103 |
-12.42 |
|
-9.84 |
| | |
|
|
|
L |
|
United Overseas Bank |
19.369 |
8/12/24 |
0.58 |
18.060 |
|
21.229 |
-3.169 |
-14.93 |
|
-7.25 |
| | |
|
|
|
S |
|
Keppel |
3.935 |
8/12/24 |
0.34 |
4.252 |
|
5.060 |
-0.808 |
-15.96 |
|
-4.33 |
| | |
|
|
|
S |
|
Wilmar International |
2.010 |
8/12/24 |
-0.98 |
2.407 |
|
2.886 |
-0.479 |
-16.60 |
|
-8.07 |
| | |
|
|
|
L |
|
CapitaLand Invest |
1.666 |
8/12/24 |
0.80 |
2.024 |
|
2.582 |
-0.558 |
-21.62 |
|
-12.35 |
| | |
|
|
|
|
|
Mapletree Pan Asia |
1.079 |
8/12/24 |
-0.81 |
1.230 |
|
1.563 |
-0.333 |
-21.32 |
|
-15.93 |
| | |
|
|
|
L |
|
Seatrium |
0.926 |
8/12/24 |
-1.41 |
1.442 |
|
1.869 |
-0.427 |
-22.86 |
|
-16.45 |
| |
|
⇓instrument |
freshest |
⇓ Δday |
11/20/23 |
⇓ Δwk |
1/09/23 |
prc diff |
Δ45 |
|
⇓∅-RS |
| | |
|
|
|
S |
|
City Developments |
3.439 |
8/12/24 |
0.97 |
4.113 |
|
5.364 |
-1.251 |
-23.32 |
|
-14.74 |
| | |
|
|
|
L |
|
ThaiBev |
0.317 |
8/12/24 |
-4.00 |
0.357 |
|
0.491 |
-0.134 |
-27.34 |
|
-12.65 |
| | |
|
|
|
S |
|
Jardine Matheson |
32.006 |
8/12/24 |
1.63 |
35.315 |
|
48.565 |
-13.251 |
-27.28 |
|
-19.02 |
| | |
|
|
|
|
|
Venture Corporation |
9.113 |
8/12/24 |
-0.72 |
8.557 |
|
12.009 |
-3.452 |
-28.75 |
|
-16.12 |
| | |
|
|
|
L |
|
DFI Retail |
1.645 |
8/12/24 |
5.68 |
2.008 |
|
2.932 |
-0.924 |
-31.52 |
|
-19.69 |
| | |
|
|
|
L |
|
Hongkong Land |
3.008 |
8/12/24 |
1.80 |
2.910 |
|
4.431 |
-1.520 |
-34.31 |
|
-19.89 |
| STI - 30 out of 30 instruments rated - 11/20/23 / 1/09/23 - 5 did rise, Market-Ratio(45) in CHF = 16.67 % |
Technical Chart
Transactions Straits Times Index in Swiss Franc * A45 - 79/68 (1)
|
⇐ |
| |
| L/S | date buy | date sell | days | | instrument | spl | pieces | | prc buy | prc sell | ps short | prc diff | d % | asset | yield | |
| 1/02/06 |
2/27/06 |
56 |
|
- cash - |
| long |
2/27/06 |
5/29/06 |
91 |
|
|
|
Singapore Exchange |
100 |
3,144 |
|
3.180 |
3.087 |
|
-0.093 |
-3 |
9,708 |
-11 |
|
| short |
5/29/06 |
9/04/06 |
98 |
|
|
|
Noble Group |
100 |
19,868 |
|
0.489 |
0.556 |
0.422 |
-0.067 |
-14 |
8,378 |
-42 |
|
| long |
9/04/06 |
11/26/07 |
448 |
|
|
|
Singapore Exchange |
100 |
2,624 |
|
3.193 |
10.783 |
|
7.590 |
238 |
28,294 |
170 |
|
| short |
11/26/07 |
8/17/09 |
630 |
|
|
|
CapitaLand ICT |
100 |
11,490 |
|
2.462 |
1.136 |
5.337 |
2.874 |
117 |
61,317 |
57 |
|
| long |
8/17/09 |
2/07/11 |
539 |
|
|
|
Yangzijiang Ship |
100 |
87,371 |
|
0.702 |
1.431 |
|
0.729 |
104 |
125,039 |
62 |
|
| short |
2/07/11 |
3/28/11 |
49 |
|
|
|
Wilmar International |
100 |
31,786 |
|
3.934 |
3.991 |
3.877 |
-0.057 |
-1 |
123,223 |
-10 |
|
| long |
3/28/11 |
5/02/11 |
35 |
|
|
|
Genting |
100 |
81,987 |
|
1.503 |
1.484 |
|
-0.019 |
-1 |
121,681 |
-12 |
|
| short |
5/02/11 |
7/02/12 |
427 |
|
|
|
Wilmar International |
100 |
33,627 |
|
3.618 |
2.639 |
4.962 |
1.343 |
37 |
166,857 |
31 |
|
| long |
7/02/12 |
6/10/13 |
343 |
|
|
|
ThaiBev |
100 |
654,652 |
|
0.255 |
0.472 |
|
0.217 |
85 |
309,080 |
93 |
|
| short |
6/10/13 |
12/05/16 |
1274 |
|
|
|
Noble Group |
100 |
408,347 |
|
0.757 |
0.118 |
4.854 |
4.097 |
541 |
1,981,953 |
70 |
|
| long |
12/05/16 |
12/19/16 |
14 |
|
|
|
Genting |
100 |
2,844,177 |
|
0.697 |
0.659 |
|
-0.038 |
-5 |
1,874,786 |
-77 |
|
| short |
12/19/16 |
5/08/17 |
140 |
|
|
|
StarHub |
100 |
958,364 |
|
1.956 |
1.961 |
1.952 |
-0.004 |
0 |
1,870,535 |
-1 |
|
| long |
5/08/17 |
6/12/17 |
35 |
|
|
|
Yangzijiang Ship |
100 |
2,081,547 |
|
0.899 |
0.851 |
|
-0.048 |
-5 |
1,770,373 |
-44 |
|
| short |
6/12/17 |
1/25/21 |
1323 |
|
|
|
StarHub |
100 |
929,808 |
|
1.904 |
0.890 |
4.075 |
2.171 |
114 |
3,788,969 |
23 |
|
| long |
1/25/21 |
6/21/21 |
147 |
|
|
|
Wilmar International |
100 |
1,024,318 |
|
3.699 |
3.109 |
|
-0.590 |
-16 |
3,185,094 |
-35 |
|
| short |
6/21/21 |
7/19/21 |
28 |
|
|
|
Keppel DC REIT |
100 |
1,813,482 |
|
1.756 |
1.750 |
1.763 |
0.006 |
0 |
3,196,626 |
5 |
|
| long |
7/19/21 |
9/27/21 |
70 |
|
|
|
Yangzijiang Ship |
100 |
3,492,069 |
|
0.915 |
0.958 |
|
0.042 |
5 |
3,344,835 |
27 |
|
| short |
9/27/21 |
8/12/24 |
1050 |
|
|
|
DFI Retail |
100 |
1,050,416 |
|
3.184 |
1.681 |
6.033 |
2.849 |
89 |
6,337,055 |
25 |
|
| accum | 2/27/06 |
8/12/24 | 7338 |
days out of 7394 invested (99%) |
63,271 |
6,337,055 |
38 |
|
Instrument Related Contribution
| instrument | L/S | date buy | date sell | days | prc buy | prc sell | ps short | prc diff | d % | | | total |
| Noble Group | short | 5/29/06 | 9/04/06 | 98 | 0.49 | 0.56 | 0.42 | -0.07 | -13.70 | | | |
| | short | 6/10/13 | 12/05/16 | 1274 | 0.76 | 0.12 | 4.85 | 4.10 | 541.24 | | | 453.39 |
| Singapore Exchange | long | 2/27/06 | 5/29/06 | 91 | 3.18 | 3.09 | | -0.09 | -2.92 | | | |
| | long | 9/04/06 | 11/26/07 | 448 | 3.19 | 10.78 | | 7.59 | 237.72 | | | 227.86 |
| CapitaLand ICT | short | 11/26/07 | 8/17/09 | 630 | 2.46 | 1.14 | 5.34 | 2.87 | 116.72 | | | 116.72 |
| StarHub | short | 12/19/16 | 5/08/17 | 140 | 1.96 | 1.96 | 1.95 | -0.00 | -0.23 | | | |
| | short | 6/12/17 | 1/25/21 | 1323 | 1.90 | 0.89 | 4.08 | 2.17 | 114.02 | | | 113.54 |
| Yangzijiang Ship | long | 8/17/09 | 2/07/11 | 539 | 0.70 | 1.43 | | 0.73 | 103.92 | | | |
| | long | 5/08/17 | 6/12/17 | 35 | 0.90 | 0.85 | | -0.05 | -5.35 | | | |
| | long | 7/19/21 | 9/27/21 | 70 | 0.92 | 0.96 | | 0.04 | 4.64 | | | 101.95 |
| DFI Retail | short | 9/27/21 | 8/12/24 | 1050 | 3.18 | 1.68 | 6.03 | 2.85 | 89.46 | | | 89.46 |
| ThaiBev | long | 7/02/12 | 6/10/13 | 343 | 0.25 | 0.47 | | 0.22 | 85.24 | | | 85.24 |
| Wilmar International | short | 2/07/11 | 3/28/11 | 49 | 3.93 | 3.99 | 3.88 | -0.06 | -1.45 | | | |
| | short | 5/02/11 | 7/02/12 | 427 | 3.62 | 2.64 | 4.96 | 1.34 | 37.13 | | | |
| | long | 1/25/21 | 6/21/21 | 147 | 3.70 | 3.11 | | -0.59 | -15.94 | | | 13.60 |
| Keppel DC REIT | short | 6/21/21 | 7/19/21 | 28 | 1.76 | 1.75 | 1.76 | 0.01 | 0.36 | | | 0.36 |
| Genting | long | 3/28/11 | 5/02/11 | 35 | 1.50 | 1.48 | | -0.02 | -1.25 | | | |
| | long | 12/05/16 | 12/19/16 | 14 | 0.70 | 0.66 | | -0.04 | -5.41 | | | -6.59 |
Annotations
| 5/07/24 | Seatrium | | | reverse split 20:1 (one for twenty) |
| 3/12/24 | STI | | | Component update: Seatrium (former Sembcorp Marine) replaces Keppel DC REIT |
| 12/07/20 | CapitaLand Mall | | | mergered with CMT |
| 1/17/18 | STI | | | Jardine Strategic and Venture Corporation replace Global Logistic and SIA Engineering Company |
| 10/31/16 | STI | | | CapitaCom Trust and Jardine Matheson replace Noble and Sembcorp Marine |
| 2/02/16 | STI | | | full technique analysis performed |
| 9/21/15 | STI | | | SATS, UOL and Yangzijiang Shipbuilding replace
Jardine Matheson, Jardine Strategic and Olam |
| 9/04/15 | STI | | | complete analysis |
|
|