| | Wed, Apr 1st, 2026, 13:56UTC |
| | |

Assessment - German Entrepreneurial Index GEX - 2/06/06 - RS = 13
⇐
| |
|
⇓instrument |
freshest |
⇓ Δday |
2/06/06 |
⇓ Δwk |
11/07/05 |
prc diff |
Δ13 |
|
⇓∅-RS |
| |  |
 |
 |
|
L |
 |
GEX PR |
1,683.690 |
8/12/24 |
1.31 |
1,683.490 |
|
1,355.970 |
327.520 |
24.15 |
|
28.91 |
| | |
|
|
|
L |
|
AUTO1 |
8.125 |
8/12/24 |
0.18 |
|
|
|
|
|
|
-na- |
| | |
|
|
|
S |
|
creditshelf |
0.050 |
8/12/24 |
|
|
|
|
|
|
|
-na- |
| | |
|
|
|
L |
|
Dermapharm |
35.150 |
8/12/24 |
0.29 |
|
|
|
|
|
|
-na- |
| | |
|
|
|
L |
|
DFV |
6.200 |
8/12/24 |
-0.80 |
|
|
|
|
|
|
-na- |
| | |
|
|
|
|
|
elumeo |
2.260 |
8/12/24 |
-0.88 |
|
|
|
|
|
|
-na- |
| | |
|
|
|
L |
|
Knaus Tabbert |
32.050 |
8/12/24 |
-1.69 |
|
|
|
|
|
|
-na- |
| | |
|
|
|
|
|
Knorr-Bremse |
70.800 |
8/12/24 |
1.36 |
|
|
|
|
|
|
-na- |
| | |
|
|
|
L |
|
Multitude |
5.520 |
8/12/24 |
-0.72 |
|
|
|
|
|
|
-na- |
| | |
|
|
|
|
|
Mutares |
31.250 |
8/12/24 |
0.16 |
|
|
|
|
|
|
-na- |
| | |
|
|
|
L |
|
Nagarro |
75.900 |
8/12/24 |
-0.20 |
|
|
|
|
|
|
-na- |
| | |
|
|
|
S |
|
Porsche |
65.680 |
8/12/24 |
-0.97 |
|
|
|
|
|
|
-na- |
| | |
|
|
|
|
|
Serviceware |
12.900 |
8/12/24 |
-3.01 |
|
|
|
|
|
|
-na- |
| | |
|
|
|
S |
|
SMA Solar |
21.900 |
8/12/24 |
-1.26 |
|
|
|
|
|
|
-na- |
| | |
|
|
|
|
|
Stemmer Imaging |
48.100 |
8/12/24 |
-0.21 |
|
|
|
|
|
|
-na- |
| | |
|
|
|
|
|
Varta |
3.610 |
8/12/24 |
41.68 |
|
|
|
|
|
|
-na- |
| GEX - 0 out of 15 instruments rated - 2/06/06 / 11/07/05 - 0 did rise, Market-Ratio(13) = -1.00 % |
| Stock Exchange Currency: EUR € Euro |
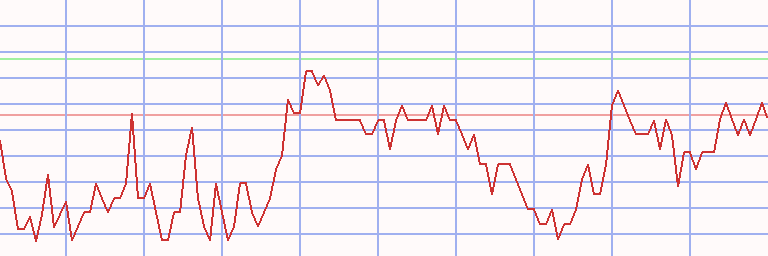
Technical Chart
Transactions German Entrepreneurial Index GEX * A13 - 77/55 (1)
|
⇐ |
| |
| L/S | date buy | date sell | days | | instrument | spl | pieces | | prc buy | prc sell | ps short | prc diff | d % | asset | yield | |
| 1/02/06 |
1/15/07 |
378 |
|
- cash - |
| short |
1/15/07 |
2/12/07 |
28 |
|
|
|
4SC |
100 |
114 |
|
87.696 |
84.948 |
90.533 |
2.837 |
3 |
10,323 |
51 |
|
| long |
2/12/07 |
3/12/07 |
28 |
|
|
|
Drägerwerk |
100 |
177 |
|
58.110 |
65.000 |
|
6.890 |
12 |
11,543 |
331 |
|
| short |
3/12/07 |
6/11/07 |
91 |
|
|
|
4SC |
100 |
146 |
|
78.995 |
74.187 |
84.115 |
5.120 |
6 |
12,290 |
29 |
|
| long |
6/11/07 |
7/23/07 |
42 |
|
|
|
Wacker Chemie |
100 |
81 |
|
149.900 |
184.380 |
|
34.480 |
23 |
15,083 |
504 |
|
| short |
7/23/07 |
4/20/09 |
637 |
|
|
|
Patrizia Immobilien |
100 |
1,321 |
|
11.410 |
2.130 |
61.121 |
49.711 |
436 |
80,752 |
162 |
|
| long |
4/20/09 |
12/14/09 |
238 |
|
|
|
Patrizia Immobilien |
100 |
37,911 |
|
2.130 |
3.050 |
|
0.920 |
43 |
115,630 |
73 |
|
| short |
12/14/09 |
10/18/10 |
308 |
|
|
|
ZhongDe Waste Tech |
100 |
9,716 |
|
11.900 |
13.830 |
9.970 |
-1.930 |
-16 |
96,878 |
-19 |
|
| long |
10/18/10 |
11/29/10 |
42 |
|
|
|
InVision |
100 |
6,827 |
|
14.190 |
15.270 |
|
1.080 |
8 |
104,251 |
89 |
|
| short |
11/29/10 |
2/14/11 |
77 |
|
|
|
MeVis Medical |
100 |
6,831 |
|
15.260 |
12.070 |
19.293 |
4.033 |
26 |
131,801 |
204 |
|
| long |
2/14/11 |
3/07/11 |
21 |
|
|
|
InVision |
100 |
6,426 |
|
20.510 |
22.905 |
|
2.395 |
12 |
147,192 |
582 |
|
| short |
3/07/11 |
2/13/12 |
343 |
|
|
|
MeVis Medical |
100 |
12,064 |
|
12.200 |
5.650 |
26.343 |
14.143 |
116 |
317,818 |
127 |
|
| long |
2/13/12 |
5/07/12 |
84 |
|
|
|
4SC |
100 |
5,159 |
|
61.593 |
48.084 |
|
-13.509 |
-22 |
248,123 |
-66 |
|
| short |
5/07/12 |
2/18/13 |
287 |
|
|
|
ZhongDe Waste Tech |
100 |
88,615 |
|
2.800 |
2.050 |
3.824 |
1.024 |
37 |
338,900 |
49 |
|
| long |
2/18/13 |
4/22/13 |
63 |
|
|
|
MBB |
100 |
18,318 |
|
18.500 |
17.650 |
|
-0.850 |
-5 |
323,330 |
-24 |
|
| short |
4/22/13 |
9/23/13 |
154 |
|
|
|
YOC |
100 |
64,038 |
|
5.049 |
2.219 |
11.488 |
6.439 |
128 |
735,684 |
602 |
|
| long |
9/23/13 |
4/14/14 |
203 |
|
|
|
Manz |
100 |
13,733 |
|
53.570 |
65.730 |
|
12.160 |
23 |
902,677 |
44 |
|
| short |
4/14/14 |
1/26/15 |
287 |
|
|
|
4SC |
100 |
31,494 |
|
28.662 |
18.284 |
44.930 |
16.268 |
57 |
1,415,034 |
77 |
|
| long |
1/26/15 |
6/01/15 |
126 |
|
|
|
Ströer Media |
100 |
52,898 |
|
26.750 |
38.770 |
|
12.020 |
45 |
2,050,868 |
193 |
|
| short |
6/01/15 |
11/23/15 |
175 |
|
|
|
ZhongDe Waste Tech |
100 |
932,212 |
|
2.200 |
1.980 |
2.444 |
0.244 |
11 |
2,278,700 |
25 |
|
| long |
11/23/15 |
12/14/15 |
21 |
|
|
|
Hypoport |
100 |
28,844 |
|
79.000 |
70.070 |
|
-8.930 |
-11 |
2,021,123 |
-88 |
|
| short |
12/14/15 |
5/09/16 |
147 |
|
|
|
Manz |
100 |
49,707 |
|
40.660 |
36.225 |
45.638 |
4.978 |
12 |
2,268,565 |
33 |
|
| long |
5/09/16 |
5/23/16 |
14 |
|
|
|
Hypoport |
100 |
29,017 |
|
78.180 |
84.790 |
|
6.610 |
8 |
2,460,367 |
730 |
|
| short |
5/23/16 |
2/27/17 |
280 |
|
|
|
Adler Modemärkte |
100 |
334,289 |
|
7.360 |
4.753 |
11.397 |
4.037 |
55 |
3,809,859 |
77 |
|
| long |
2/27/17 |
5/22/17 |
84 |
|
|
|
MBB |
100 |
44,533 |
|
85.550 |
109.000 |
|
23.450 |
27 |
4,854,157 |
187 |
|
| short |
5/22/17 |
3/11/19 |
658 |
|
|
|
InVision |
100 |
167,327 |
|
29.010 |
16.400 |
51.316 |
22.306 |
77 |
8,586,537 |
37 |
|
| L/S | date buy | date sell | days | | instrument | spl | pieces | | prc buy | prc sell | ps short | prc diff | d % | asset | yield | | | long |
3/11/19 |
5/13/19 |
63 |
|
|
|
Varta |
100 |
238,514 |
|
36.000 |
43.250 |
|
7.250 |
20 |
10,315,763 |
190 |
|
| short |
5/13/19 |
6/15/20 |
399 |
|
|
|
elumeo |
100 |
6,970,110 |
|
1.480 |
1.290 |
1.698 |
0.218 |
15 |
11,835,247 |
13 |
|
| long |
6/15/20 |
8/10/20 |
56 |
|
|
|
va-Q-tec |
100 |
771,025 |
|
15.350 |
18.500 |
|
3.150 |
21 |
14,263,976 |
238 |
|
| short |
8/10/20 |
1/25/21 |
168 |
|
|
|
Vapiano |
100 |
36,574,297 |
|
0.390 |
0.260 |
0.585 |
0.195 |
50 |
21,395,964 |
141 |
|
| long |
1/25/21 |
4/19/21 |
84 |
|
|
|
Akasol |
100 |
206,564 |
|
103.580 |
119.800 |
|
16.220 |
16 |
24,746,432 |
88 |
|
| short |
4/19/21 |
8/16/21 |
119 |
|
|
|
DFV |
100 |
1,918,328 |
|
12.900 |
14.500 |
11.300 |
-1.600 |
-12 |
21,677,107 |
-33 |
|
| long |
8/16/21 |
9/06/21 |
21 |
|
|
|
elumeo |
100 |
2,890,280 |
|
7.500 |
6.500 |
|
-1.000 |
-13 |
18,786,827 |
-92 |
|
| short |
9/06/21 |
8/12/24 |
1071 |
|
|
|
Voltabox |
100 |
7,469,911 |
|
2.515 |
1.400 |
4.518 |
2.003 |
80 |
33,749,059 |
22 |
|
| accum | 1/15/07 |
8/12/24 | 7016 |
days out of 7394 invested (95%) |
337,391 |
33,749,059 |
53 |
|
Instrument Related Contribution
| instrument | L/S | date buy | date sell | days | prc buy | prc sell | ps short | prc diff | d % | | | total |
| Patrizia Immobilien | short | 7/23/07 | 4/20/09 | 637 | 11.41 | 2.13 | 61.12 | 49.71 | 435.68 | | | |
| | long | 4/20/09 | 12/14/09 | 238 | 2.13 | 3.05 | | 0.92 | 43.19 | | | 667.05 |
| MeVis Medical | short | 11/29/10 | 2/14/11 | 77 | 15.26 | 12.07 | 19.29 | 4.03 | 26.43 | | | |
| | short | 3/07/11 | 2/13/12 | 343 | 12.20 | 5.65 | 26.34 | 14.14 | 115.93 | | | 173.00 |
| YOC | short | 4/22/13 | 9/23/13 | 154 | 5.05 | 2.22 | 11.49 | 6.44 | 127.53 | | | 127.53 |
| InVision | long | 10/18/10 | 11/29/10 | 42 | 14.19 | 15.27 | | 1.08 | 7.61 | | | |
| | long | 2/14/11 | 3/07/11 | 21 | 20.51 | 22.91 | | 2.40 | 11.68 | | | |
| | short | 5/22/17 | 3/11/19 | 658 | 29.01 | 16.40 | 51.32 | 22.31 | 76.89 | | | 112.58 |
| Voltabox | short | 9/06/21 | 8/12/24 | 1071 | 2.52 | 1.40 | 4.52 | 2.00 | 79.64 | | | 79.64 |
| Adler Modemärkte | short | 5/23/16 | 2/27/17 | 280 | 7.36 | 4.75 | 11.40 | 4.04 | 54.85 | | | 54.85 |
| Vapiano | short | 8/10/20 | 1/25/21 | 168 | 0.39 | 0.26 | 0.59 | 0.20 | 50.00 | | | 50.00 |
| Ströer Media | long | 1/26/15 | 6/01/15 | 126 | 26.75 | 38.77 | | 12.02 | 44.93 | | | 44.93 |
| Manz | long | 9/23/13 | 4/14/14 | 203 | 53.57 | 65.73 | | 12.16 | 22.70 | | | |
| | short | 12/14/15 | 5/09/16 | 147 | 40.66 | 36.23 | 45.64 | 4.98 | 12.24 | | | 37.72 |
| 4SC | short | 1/15/07 | 2/12/07 | 28 | 87.70 | 84.95 | 90.53 | 2.84 | 3.23 | | | |
| | short | 3/12/07 | 6/11/07 | 91 | 79.00 | 74.19 | 84.12 | 5.12 | 6.48 | | | |
| | long | 2/13/12 | 5/07/12 | 84 | 61.59 | 48.08 | | -13.51 | -21.93 | | | |
| | short | 4/14/14 | 1/26/15 | 287 | 28.66 | 18.28 | 44.93 | 16.27 | 56.76 | | | 34.53 |
| ZhongDe Waste Tech | short | 12/14/09 | 10/18/10 | 308 | 11.90 | 13.83 | 9.97 | -1.93 | -16.22 | | | |
| | short | 5/07/12 | 2/18/13 | 287 | 2.80 | 2.05 | 3.82 | 1.02 | 36.59 | | | |
| | short | 6/01/15 | 11/23/15 | 175 | 2.20 | 1.98 | 2.44 | 0.24 | 11.11 | | | 27.15 |
| Wacker Chemie | long | 6/11/07 | 7/23/07 | 42 | 149.90 | 184.38 | | 34.48 | 23.00 | | | 23.00 |
| MBB | long | 2/18/13 | 4/22/13 | 63 | 18.50 | 17.65 | | -0.85 | -4.59 | | | |
| | long | 2/27/17 | 5/22/17 | 84 | 85.55 | 109.00 | | 23.45 | 27.41 | | | 21.56 |
| va-Q-tec | long | 6/15/20 | 8/10/20 | 56 | 15.35 | 18.50 | | 3.15 | 20.52 | | | 20.52 |
| instrument | L/S | date buy | date sell | days | prc buy | prc sell | ps short | prc diff | d % | | | total |
| Varta | long | 3/11/19 | 5/13/19 | 63 | 36.00 | 43.25 | | 7.25 | 20.14 | | | 20.14 |
| Akasol | long | 1/25/21 | 4/19/21 | 84 | 103.58 | 119.80 | | 16.22 | 15.66 | | | 15.66 |
| Drägerwerk | long | 2/12/07 | 3/12/07 | 28 | 58.11 | 65.00 | | 6.89 | 11.86 | | | 11.86 |
| elumeo | short | 5/13/19 | 6/15/20 | 399 | 1.48 | 1.29 | 1.70 | 0.22 | 14.73 | | | |
| | long | 8/16/21 | 9/06/21 | 21 | 7.50 | 6.50 | | -1.00 | -13.33 | | | -0.57 |
| Hypoport | long | 11/23/15 | 12/14/15 | 21 | 79.00 | 70.07 | | -8.93 | -11.30 | | | |
| | long | 5/09/16 | 5/23/16 | 14 | 78.18 | 84.79 | | 6.61 | 8.45 | | | -3.80 |
| DFV | short | 4/19/21 | 8/16/21 | 119 | 12.90 | 14.50 | 11.30 | -1.60 | -12.40 | | | -12.40 |
Annotations
| 2/21/24 | GEX | | | Component update: The Social Chain (insolvency) and va-Q-tec (acuisition by EQT) retire |
| 2/10/17 | GEX | | | machine learning processed for all techniques |
| 2/06/17 | GEX | | | implementation |
| 6/21/15 | Ferratum | | | recording started |
|
|