| | Wed, Apr 1st, 2026, 7:13UTC |
| | |

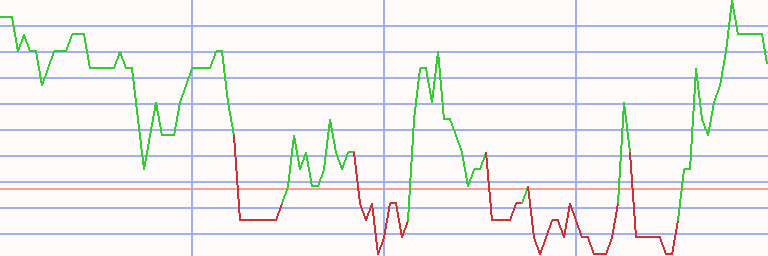
Assessment - Dow Jones Utility Average in Swiss Franc - 7/01/24 - RS = 32
⇐
| |
|
⇓instrument |
freshest |
⇓ Δday |
7/01/24 |
⇓ Δwk |
11/20/23 |
prc diff |
Δ32 |
|
⇓∅-RS |
| |  |
 |
 |
|
L |
 |
DJUA |
904.451 |
8/12/24 |
0.36 |
812.199 |
11.36 |
760.795 |
51.405 |
6.76 |
|
4.73 |
| | |
|
|
|
L |
|
NextEra Energy |
70.103 |
8/12/24 |
0.15 |
63.164 |
10.99 |
50.725 |
12.439 |
24.52 |
|
12.94 |
| | |
|
|
|
L |
|
PSEG |
72.751 |
8/12/24 |
0.81 |
66.534 |
9.34 |
56.625 |
9.909 |
17.50 |
|
18.83 |
| | |
|
|
|
L |
|
AEP |
87.778 |
8/12/24 |
-0.40 |
78.869 |
11.30 |
68.285 |
10.584 |
15.50 |
|
9.22 |
| | |
|
|
|
L |
|
Duke Energy |
102.444 |
8/12/24 |
0.62 |
89.775 |
14.11 |
78.998 |
10.778 |
13.64 |
|
7.92 |
| | |
|
|
|
L |
|
Southern |
78.796 |
8/12/24 |
0.46 |
69.579 |
13.25 |
61.429 |
8.150 |
13.27 |
|
11.60 |
| | |
|
|
|
|
|
Edison International |
74.468 |
8/12/24 |
0.52 |
64.329 |
15.76 |
58.112 |
6.218 |
10.70 |
|
5.56 |
| | |
|
|
|
L |
|
Sempra |
71.378 |
8/12/24 |
0.74 |
67.745 |
5.36 |
64.074 |
3.671 |
5.73 |
|
5.83 |
| | |
|
|
|
|
|
Dominion Resources |
49.447 |
8/12/24 |
0.46 |
43.383 |
13.98 |
41.056 |
2.327 |
5.67 |
|
2.24 |
| | |
|
|
|
|
|
Atmos Energy |
116.243 |
8/12/24 |
0.46 |
104.803 |
10.92 |
99.893 |
4.910 |
4.92 |
|
3.00 |
| | |
|
|
|
|
|
FirstEnergy |
38.133 |
8/12/24 |
0.55 |
34.618 |
10.15 |
33.112 |
1.506 |
4.55 |
|
4.53 |
| | |
|
|
|
L |
|
AES |
15.100 |
8/12/24 |
0.30 |
15.759 |
-4.19 |
15.225 |
0.535 |
3.51 |
|
1.11 |
| | |
|
|
|
L |
|
American Water |
128.821 |
8/12/24 |
0.20 |
115.448 |
11.58 |
115.595 |
-0.148 |
-0.13 |
|
1.06 |
| | |
|
|
|
|
|
Consolidated Edison |
92.116 |
8/12/24 |
0.91 |
80.251 |
14.78 |
80.449 |
-0.197 |
-0.25 |
|
-0.20 |
| | |
|
|
|
|
|
Exelon |
33.344 |
8/12/24 |
-0.54 |
31.220 |
6.80 |
34.572 |
-3.351 |
-9.69 |
|
-7.42 |
| | |
|
|
|
L |
|
Xcel Energy |
52.429 |
8/12/24 |
0.10 |
47.377 |
10.66 |
53.131 |
-5.754 |
-10.83 |
|
-7.84 |
| DJUA - 15 out of 15 instruments rated - 7/01/24 / 11/20/23 - 11 did rise, Market-Ratio(32) in CHF = 73.33 % |
| Stock Exchange Currency: USD $ Dollar |
Technical Chart
Transactions Dow Jones Utility Average in Swiss Franc * L32 - 26 ex 8 (1)
|
⇐ |
| |
| L/S | date buy | date sell | days | | instrument | spl | pieces | | prc buy | prc sell | | prc diff | d % | asset | yield | | | long |
1/02/06 |
4/10/06 |
98 |
|
|
|
Edison International |
100 |
169 |
|
58.824 |
52.567 |
|
-6.257 |
-11 |
8,943 |
-34 |
|
| 4/10/06 |
5/08/06 |
28 |
|
- cash - |
| |
5/08/06 |
5/15/06 |
7 |
|
|
|
AES |
100 |
410 |
|
21.768 |
21.857 |
|
0.089 |
0 |
8,979 |
24 |
|
| 5/15/06 |
5/22/06 |
7 |
|
- cash - |
| |
5/22/06 |
2/05/07 |
259 |
|
|
|
AES |
100 |
409 |
|
21.936 |
26.344 |
|
4.408 |
20 |
10,782 |
29 |
|
| |
2/05/07 |
3/03/08 |
392 |
|
|
|
NextEra Energy |
100 |
589 |
|
18.292 |
15.969 |
|
-2.323 |
-13 |
9,414 |
-12 |
|
| 3/03/08 |
3/10/08 |
7 |
|
- cash - |
| |
3/10/08 |
3/31/08 |
21 |
|
|
|
Exelon |
100 |
118 |
|
79.171 |
80.864 |
|
1.692 |
2 |
9,614 |
44 |
|
| 3/31/08 |
4/07/08 |
7 |
|
- cash - |
| |
4/07/08 |
6/09/08 |
63 |
|
|
|
Exelon |
100 |
115 |
|
82.912 |
90.252 |
|
7.340 |
9 |
10,458 |
63 |
|
| 6/09/08 |
6/23/08 |
14 |
|
- cash - |
| |
6/23/08 |
7/14/08 |
21 |
|
|
|
FirstEnergy |
100 |
123 |
|
84.714 |
83.744 |
|
-0.970 |
-1 |
10,338 |
-18 |
|
| 7/14/08 |
9/01/08 |
49 |
|
- cash - |
| |
9/01/08 |
9/15/08 |
14 |
|
|
|
Southern |
100 |
251 |
|
41.058 |
43.042 |
|
1.985 |
5 |
10,836 |
242 |
|
| 9/15/08 |
9/22/08 |
7 |
|
- cash - |
| |
9/22/08 |
9/29/08 |
7 |
|
|
|
Southern |
100 |
260 |
|
41.676 |
40.625 |
|
-1.051 |
-3 |
10,563 |
-74 |
|
| 9/29/08 |
5/25/09 |
238 |
|
- cash - |
| |
5/25/09 |
10/12/09 |
140 |
|
|
|
NextEra Energy |
100 |
707 |
|
14.920 |
13.743 |
|
-1.177 |
-8 |
9,731 |
-19 |
|
| |
10/12/09 |
3/15/10 |
154 |
|
|
|
AES |
100 |
635 |
|
15.316 |
12.241 |
|
-3.075 |
-20 |
7,778 |
-41 |
|
| |
3/15/10 |
5/31/10 |
77 |
|
|
|
Dominion Resources |
100 |
185 |
|
42.011 |
44.735 |
|
2.724 |
6 |
8,282 |
35 |
|
| 5/31/10 |
6/07/10 |
7 |
|
- cash - |
| |
6/07/10 |
11/01/10 |
147 |
|
|
|
Dominion Resources |
100 |
181 |
|
45.710 |
41.741 |
|
-3.970 |
-9 |
7,563 |
-20 |
|
| |
11/01/10 |
4/11/11 |
161 |
|
|
|
Xcel Energy |
100 |
325 |
|
23.253 |
21.327 |
|
-1.926 |
-8 |
6,937 |
-18 |
|
| |
4/11/11 |
6/18/12 |
434 |
|
|
|
American Water |
100 |
269 |
|
25.726 |
32.208 |
|
6.482 |
25 |
8,681 |
21 |
|
| |
6/18/12 |
12/01/14 |
896 |
|
|
|
Sempra |
100 |
265 |
|
32.650 |
52.695 |
|
20.045 |
61 |
13,993 |
22 |
|
| |
12/01/14 |
4/20/15 |
140 |
|
|
|
Edison International |
100 |
228 |
|
61.341 |
58.951 |
|
-2.390 |
-4 |
13,448 |
-10 |
|
| |
4/20/15 |
6/08/15 |
49 |
|
|
|
American Water |
100 |
259 |
|
51.751 |
47.384 |
|
-4.367 |
-8 |
12,317 |
-48 |
|
| 6/08/15 |
8/17/15 |
70 |
|
- cash - |
| |
8/17/15 |
8/24/15 |
7 |
|
|
|
Atmos Energy |
100 |
217 |
|
56.580 |
51.489 |
|
-5.090 |
-9 |
11,212 |
-99 |
|
| 8/24/15 |
9/28/15 |
35 |
|
- cash - |
| |
9/28/15 |
12/14/15 |
77 |
|
|
|
Atmos Energy |
100 |
199 |
|
56.099 |
59.968 |
|
3.870 |
7 |
11,982 |
37 |
|
| 12/14/15 |
12/21/15 |
7 |
|
- cash - |
| |
12/21/15 |
11/07/16 |
322 |
|
|
|
Atmos Energy |
100 |
194 |
|
61.614 |
71.929 |
|
10.316 |
17 |
13,984 |
19 |
|
| |
11/07/16 |
11/21/16 |
14 |
|
|
|
NextEra Energy |
100 |
441 |
|
31.639 |
28.830 |
|
-2.809 |
-9 |
12,745 |
-91 |
|
| 11/21/16 |
12/05/16 |
14 |
|
- cash - |
| |
12/05/16 |
12/12/16 |
7 |
|
|
|
AES |
100 |
1,113 |
|
11.445 |
12.173 |
|
0.727 |
6 |
13,554 |
2,385 |
|
| 12/12/16 |
12/19/16 |
7 |
|
- cash - |
| |
12/19/16 |
1/23/17 |
35 |
|
|
|
Exelon |
100 |
369 |
|
36.715 |
35.159 |
|
-1.556 |
-4 |
12,980 |
-36 |
|
| 1/23/17 |
3/20/17 |
56 |
|
- cash - |
| |
3/20/17 |
7/03/17 |
105 |
|
|
|
Edison International |
100 |
164 |
|
78.697 |
74.393 |
|
-4.305 |
-5 |
12,274 |
-18 |
|
| L/S | date buy | date sell | days | | instrument | spl | pieces | | prc buy | prc sell | | prc diff | d % | asset | yield | | | |
7/03/17 |
2/05/18 |
217 |
|
|
|
NextEra Energy |
100 |
364 |
|
33.644 |
36.123 |
|
2.478 |
7 |
13,176 |
13 |
|
| 2/05/18 |
2/12/18 |
7 |
|
- cash - |
| |
2/12/18 |
7/23/18 |
161 |
|
|
|
NextEra Energy |
100 |
374 |
|
35.199 |
41.901 |
|
6.702 |
19 |
15,683 |
48 |
|
| 7/23/18 |
7/30/18 |
7 |
|
- cash - |
| |
7/30/18 |
5/13/19 |
287 |
|
|
|
AES |
100 |
1,193 |
|
13.137 |
16.199 |
|
3.062 |
23 |
19,336 |
31 |
|
| |
5/13/19 |
3/16/20 |
308 |
|
|
|
American Water |
100 |
173 |
|
111.301 |
112.471 |
|
1.171 |
1 |
19,539 |
1 |
|
| 3/16/20 |
3/30/20 |
14 |
|
- cash - |
| |
3/30/20 |
4/06/20 |
7 |
|
|
|
NextEra Energy |
100 |
330 |
|
59.035 |
57.285 |
|
-1.751 |
-3 |
18,961 |
-79 |
|
| 4/06/20 |
4/20/20 |
14 |
|
- cash - |
| |
4/20/20 |
5/04/20 |
14 |
|
|
|
NextEra Energy |
100 |
330 |
|
57.439 |
55.545 |
|
-1.893 |
-3 |
18,336 |
-58 |
|
| 5/04/20 |
6/01/20 |
28 |
|
- cash - |
| |
6/01/20 |
6/29/20 |
28 |
|
|
|
NextEra Energy |
100 |
298 |
|
61.403 |
56.699 |
|
-4.704 |
-8 |
16,934 |
-65 |
|
| 6/29/20 |
10/12/20 |
105 |
|
- cash - |
| |
10/12/20 |
3/01/21 |
140 |
|
|
|
American Water |
100 |
117 |
|
143.879 |
121.393 |
|
-22.486 |
-16 |
14,303 |
-36 |
|
| |
3/01/21 |
8/02/21 |
154 |
|
|
|
AES |
100 |
578 |
|
24.705 |
21.326 |
|
-3.379 |
-14 |
12,351 |
-29 |
|
| |
8/02/21 |
5/09/22 |
280 |
|
|
|
FirstEnergy |
100 |
354 |
|
34.799 |
41.825 |
|
7.026 |
20 |
14,838 |
27 |
|
| |
5/09/22 |
10/10/22 |
154 |
|
|
|
Sempra |
100 |
184 |
|
80.352 |
73.792 |
|
-6.560 |
-8 |
13,631 |
-18 |
|
| 10/10/22 |
12/12/22 |
63 |
|
- cash - |
| |
12/12/22 |
1/02/23 |
21 |
|
|
|
AES |
100 |
500 |
|
27.234 |
26.604 |
|
-0.630 |
-2 |
13,316 |
-33 |
|
| 1/02/23 |
1/16/23 |
14 |
|
- cash - |
| |
1/16/23 |
3/06/23 |
49 |
|
|
|
AES |
100 |
516 |
|
25.789 |
23.282 |
|
-2.507 |
-10 |
12,022 |
-53 |
|
| 3/06/23 |
5/08/23 |
63 |
|
- cash - |
| |
5/08/23 |
8/07/23 |
91 |
|
|
|
Edison International |
100 |
184 |
|
65.242 |
60.978 |
|
-4.264 |
-7 |
11,238 |
-24 |
|
| 8/07/23 |
9/18/23 |
42 |
|
- cash - |
| |
9/18/23 |
9/25/23 |
7 |
|
|
|
Edison International |
100 |
176 |
|
63.847 |
61.660 |
|
-2.188 |
-3 |
10,853 |
-84 |
|
| 9/25/23 |
1/08/24 |
105 |
|
- cash - |
| |
1/08/24 |
1/22/24 |
14 |
|
|
|
Edison International |
100 |
175 |
|
61.965 |
58.743 |
|
-3.222 |
-5 |
10,289 |
-75 |
|
| 1/22/24 |
3/18/24 |
56 |
|
- cash - |
| |
3/18/24 |
8/12/24 |
147 |
|
|
|
PSEG |
100 |
181 |
|
56.841 |
72.751 |
|
15.910 |
28 |
13,169 |
85 |
|
| accum | 1/02/06 |
8/12/24 | 6323 |
days out of 7394 invested (86%) |
32 |
13,169 |
2 |
|
Instrument Related Contribution
| instrument | L/S | date buy | date sell | days | prc buy | prc sell | | prc diff | d % | | | total |
| Sempra | long | 6/18/12 | 12/01/14 | 896 | 32.65 | 52.69 | | 20.04 | 61.39 | | | |
| | | 5/09/22 | 10/10/22 | 154 | 80.35 | 73.79 | | -6.56 | -8.16 | | | 48.22 |
| PSEG | | 3/18/24 | 8/12/24 | 147 | 56.84 | 72.75 | | 15.91 | 27.99 | | | 27.99 |
| FirstEnergy | | 6/23/08 | 7/14/08 | 21 | 84.71 | 83.74 | | -0.97 | -1.15 | | | |
| | | 8/02/21 | 5/09/22 | 280 | 34.80 | 41.82 | | 7.03 | 20.19 | | | 18.81 |
| Atmos Energy | | 8/17/15 | 8/24/15 | 7 | 56.58 | 51.49 | | -5.09 | -9.00 | | | |
| | | 9/28/15 | 12/14/15 | 77 | 56.10 | 59.97 | | 3.87 | 6.90 | | | |
| | | 12/21/15 | 11/07/16 | 322 | 61.61 | 71.93 | | 10.32 | 16.74 | | | 13.57 |
| Exelon | | 3/10/08 | 3/31/08 | 21 | 79.17 | 80.86 | | 1.69 | 2.14 | | | |
| | | 4/07/08 | 6/09/08 | 63 | 82.91 | 90.25 | | 7.34 | 8.85 | | | |
| | | 12/19/16 | 1/23/17 | 35 | 36.72 | 35.16 | | -1.56 | -4.24 | | | 6.47 |
| Southern | | 9/01/08 | 9/15/08 | 14 | 41.06 | 43.04 | | 1.98 | 4.83 | | | |
| | | 9/22/08 | 9/29/08 | 7 | 41.68 | 40.63 | | -1.05 | -2.52 | | | 2.19 |
| American Water | | 4/11/11 | 6/18/12 | 434 | 25.73 | 32.21 | | 6.48 | 25.20 | | | |
| | | 4/20/15 | 6/08/15 | 49 | 51.75 | 47.38 | | -4.37 | -8.44 | | | |
| | | 5/13/19 | 3/16/20 | 308 | 111.30 | 112.47 | | 1.17 | 1.05 | | | |
| | | 10/12/20 | 3/01/21 | 140 | 143.88 | 121.39 | | -22.49 | -15.63 | | | -2.27 |
| Dominion Resources | | 3/15/10 | 5/31/10 | 77 | 42.01 | 44.73 | | 2.72 | 6.48 | | | |
| | | 6/07/10 | 11/01/10 | 147 | 45.71 | 41.74 | | -3.97 | -8.68 | | | -2.76 |
| AES | | 5/08/06 | 5/15/06 | 7 | 21.77 | 21.86 | | 0.09 | 0.41 | | | |
| | | 5/22/06 | 2/05/07 | 259 | 21.94 | 26.34 | | 4.41 | 20.10 | | | |
| | | 10/12/09 | 3/15/10 | 154 | 15.32 | 12.24 | | -3.08 | -20.08 | | | |
| | | 12/05/16 | 12/12/16 | 7 | 11.45 | 12.17 | | 0.73 | 6.36 | | | |
| | | 7/30/18 | 5/13/19 | 287 | 13.14 | 16.20 | | 3.06 | 23.31 | | | |
| | | 3/01/21 | 8/02/21 | 154 | 24.70 | 21.33 | | -3.38 | -13.68 | | | |
| | | 12/12/22 | 1/02/23 | 21 | 27.23 | 26.60 | | -0.63 | -2.31 | | | |
| | | 1/16/23 | 3/06/23 | 49 | 25.79 | 23.28 | | -2.51 | -9.72 | | | -3.78 |
| instrument | L/S | date buy | date sell | days | prc buy | prc sell | | prc diff | d % | | | total |
| Xcel Energy | | 11/01/10 | 4/11/11 | 161 | 23.25 | 21.33 | | -1.93 | -8.28 | | | -8.28 |
| NextEra Energy | | 2/05/07 | 3/03/08 | 392 | 18.29 | 15.97 | | -2.32 | -12.70 | | | |
| | | 5/25/09 | 10/12/09 | 140 | 14.92 | 13.74 | | -1.18 | -7.89 | | | |
| | | 11/07/16 | 11/21/16 | 14 | 31.64 | 28.83 | | -2.81 | -8.88 | | | |
| | | 7/03/17 | 2/05/18 | 217 | 33.64 | 36.12 | | 2.48 | 7.37 | | | |
| | | 2/12/18 | 7/23/18 | 161 | 35.20 | 41.90 | | 6.70 | 19.04 | | | |
| | | 3/30/20 | 4/06/20 | 7 | 59.04 | 57.28 | | -1.75 | -2.97 | | | |
| | | 4/20/20 | 5/04/20 | 14 | 57.44 | 55.55 | | -1.89 | -3.30 | | | |
| | | 6/01/20 | 6/29/20 | 28 | 61.40 | 56.70 | | -4.70 | -7.66 | | | -18.86 |
| Edison International | | 1/02/06 | 4/10/06 | 98 | 58.82 | 52.57 | | -6.26 | -10.64 | | | |
| | | 12/01/14 | 4/20/15 | 140 | 61.34 | 58.95 | | -2.39 | -3.90 | | | |
| | | 3/20/17 | 7/03/17 | 105 | 78.70 | 74.39 | | -4.30 | -5.47 | | | |
| | | 5/08/23 | 8/07/23 | 91 | 65.24 | 60.98 | | -4.26 | -6.54 | | | |
| | | 9/18/23 | 9/25/23 | 7 | 63.85 | 61.66 | | -2.19 | -3.43 | | | |
| | | 1/08/24 | 1/22/24 | 14 | 61.96 | 58.74 | | -3.22 | -5.20 | | | -30.53 |
Annotations
| 8/22/23 | Sempra | | | stock split 1:2 (two for one) |
|
|