| | Wed, Apr 1st, 2026, 7:11UTC |
| | |

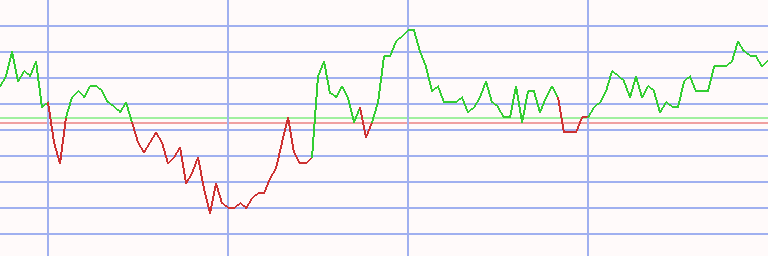
Assessment - DJ Global Titans 50 in Swiss Franc - 6/13/22 - RS = 30
⇐
| |
|
⇓instrument |
freshest |
Δday |
6/13/22 |
⇓ Δwk |
11/15/21 |
prc diff |
⇓ Δ30 |
|
⇓∅-RS |
| |  |
 |
 |
|
|
 |
DJ Global Titans |
642.696 |
8/12/24 |
|
412.242 |
|
498.344 |
-86.102 |
-17.28 |
|
-12.07 |
| | |
|
|
|
L |
|
NVidia |
108.523 |
8/12/24 |
4.08 |
15.576 |
|
27.700 |
-12.124 |
-43.77 |
|
-25.61 |
| | |
|
|
|
|
|
BP |
532.856 |
8/12/24 |
1.35 |
516.735 |
|
423.403 |
93.332 |
22.04 |
|
19.43 |
| | |
|
|
|
L |
|
Walmart |
68.387 |
8/12/24 |
1.10 |
39.622 |
|
45.177 |
-5.556 |
-12.30 |
|
-10.26 |
| | |
|
|
|
|
|
Samsung Electronics |
58.262 |
8/12/24 |
1.07 |
47.921 |
|
55.786 |
-7.864 |
-14.10 |
|
-16.16 |
| | |
|
|
|
|
|
Shell |
34.323 |
8/12/24 |
0.93 |
27.708 |
|
20.751 |
6.957 |
33.53 |
|
28.42 |
| | |
|
|
|
L |
|
Apple |
216.538 |
8/12/24 |
0.71 |
131.279 |
|
138.383 |
-7.104 |
-5.13 |
|
-8.61 |
| | |
|
|
|
|
|
TotalEnergies |
64.146 |
8/12/24 |
0.60 |
55.447 |
|
45.870 |
9.577 |
20.88 |
|
20.91 |
| | |
|
|
|
S |
|
McDonald´s |
268.231 |
8/12/24 |
0.58 |
237.383 |
|
233.350 |
4.033 |
1.73 |
|
4.10 |
| | |
|
|
|
|
|
GSK |
1,905.482 |
8/12/24 |
0.42 |
2,120.491 |
|
1,982.301 |
138.190 |
6.97 |
|
9.26 |
| | |
|
|
|
L |
|
Oracle |
131.976 |
8/12/24 |
0.39 |
63.758 |
|
86.738 |
-22.980 |
-26.49 |
|
-18.43 |
| | |
|
|
|
L |
|
Taiwan Semiconductor |
166.866 |
8/12/24 |
0.31 |
85.160 |
|
108.972 |
-23.812 |
-21.85 |
|
-18.01 |
| | |
|
|
|
L |
|
Roche |
277.800 |
8/12/24 |
0.25 |
309.250 |
|
369.000 |
-59.750 |
-16.19 |
|
-13.24 |
| | |
|
|
|
L |
|
HSBC |
780.496 |
8/12/24 |
0.22 |
609.585 |
|
541.356 |
68.229 |
12.60 |
|
8.24 |
| | |
|
|
|
|
|
JP Morgan Chase |
205.250 |
8/12/24 |
0.19 |
115.461 |
|
153.660 |
-38.199 |
-24.86 |
|
-16.59 |
| | |
|
|
|
|
|
Microsoft |
404.955 |
8/12/24 |
0.19 |
241.156 |
|
310.042 |
-68.886 |
-22.22 |
|
-12.17 |
| | |
|
|
|
L |
|
Novartis |
96.740 |
8/12/24 |
0.16 |
82.780 |
|
76.200 |
6.580 |
8.64 |
|
2.16 |
| | |
|
|
|
|
|
AbbVie |
189.313 |
8/12/24 |
0.13 |
138.784 |
|
107.791 |
30.993 |
28.75 |
|
17.03 |
| | |
|
|
|
|
|
Exxon Mobil |
118.457 |
8/12/24 |
0.13 |
95.413 |
|
59.385 |
36.028 |
60.67 |
|
51.89 |
| | |
|
|
|
L |
|
Philip Morris |
115.561 |
8/12/24 |
0.07 |
98.051 |
|
87.975 |
10.076 |
11.45 |
|
7.08 |
| | |
|
|
|
|
|
Visa |
258.705 |
8/12/24 |
0.05 |
191.383 |
|
195.858 |
-4.474 |
-2.28 |
|
-5.95 |
| | |
|
|
|
|
|
Chevron |
144.359 |
8/12/24 |
0.02 |
166.567 |
|
107.772 |
58.795 |
54.55 |
|
47.35 |
| | |
|
|
|
|
|
Siemens |
163.378 |
8/12/24 |
0.01 |
115.986 |
|
157.728 |
-41.742 |
-26.46 |
|
-18.08 |
| | |
|
|
|
|
|
Allianz |
265.957 |
8/12/24 |
|
189.194 |
|
216.264 |
-27.070 |
-12.52 |
|
-12.67 |
| | |
|
|
|
L |
|
BAT |
3,395.201 |
8/12/24 |
|
4,206.728 |
|
3,246.646 |
960.082 |
29.57 |
|
16.73 |
| |
|
⇓instrument |
freshest |
Δday |
6/13/22 |
⇓ Δwk |
11/15/21 |
prc diff |
⇓ Δ30 |
|
⇓∅-RS |
| | |
|
|
|
|
|
Citigroup |
57.576 |
8/12/24 |
|
45.482 |
|
63.416 |
-17.935 |
-28.28 |
|
-21.75 |
| | |
|
|
|
|
|
Amazon.com |
166.040 |
8/12/24 |
-0.08 |
103.197 |
|
163.554 |
-60.356 |
-36.90 |
|
-29.24 |
| | |
|
|
|
|
|
Toyota |
18.162 |
8/09/24 |
-0.14 |
15.817 |
|
17.011 |
-1.194 |
-7.02 |
|
-4.32 |
| | |
|
|
|
|
|
General Electric |
166.109 |
8/12/24 |
-0.16 |
67.411 |
|
98.409 |
-30.997 |
-31.50 |
|
-24.17 |
| | |
|
|
|
|
|
Mastercard |
453.612 |
8/12/24 |
-0.24 |
318.282 |
|
333.373 |
-15.091 |
-4.53 |
|
-3.26 |
| | |
|
|
|
L |
|
DuPont |
77.973 |
8/12/24 |
-0.25 |
60.592 |
|
72.669 |
-12.077 |
-16.62 |
|
-11.69 |
| | |
|
|
|
|
|
Walt Disney |
85.558 |
8/12/24 |
-0.30 |
95.274 |
|
146.160 |
-50.886 |
-34.82 |
|
-31.62 |
| | |
|
|
|
|
|
Meta Platforms |
513.598 |
8/12/24 |
-0.35 |
163.511 |
|
320.642 |
-157.131 |
-49.01 |
|
-36.91 |
| | |
|
|
|
L |
|
Pfizer |
28.320 |
8/12/24 |
-0.35 |
47.692 |
|
45.805 |
1.887 |
4.12 |
|
7.20 |
| | |
|
|
|
L |
|
Nestlé |
88.640 |
8/12/24 |
-0.40 |
110.740 |
|
123.100 |
-12.360 |
-10.04 |
|
-6.53 |
| | |
|
|
|
S |
|
Johnson & Johnson |
159.151 |
8/12/24 |
-0.46 |
170.031 |
|
150.856 |
19.176 |
12.71 |
|
8.03 |
| | |
|
|
|
|
|
Anheuser-Busch InBev |
57.369 |
8/12/24 |
-0.47 |
51.248 |
|
55.330 |
-4.082 |
-7.38 |
|
-8.99 |
| | |
|
|
|
|
|
BHP |
28.078 |
8/12/24 |
-0.54 |
31.933 |
|
25.426 |
6.507 |
25.59 |
|
6.09 |
| | |
|
|
|
|
|
PepsiCo |
170.638 |
8/12/24 |
-0.56 |
159.012 |
|
151.114 |
7.898 |
5.23 |
|
5.61 |
| | |
|
|
|
|
|
Sanofi |
99.430 |
8/12/24 |
-0.60 |
99.638 |
|
94.673 |
4.965 |
5.24 |
|
4.66 |
| | |
|
|
|
L |
|
3M |
122.798 |
8/12/24 |
-0.65 |
135.748 |
|
169.113 |
-33.365 |
-19.73 |
|
-14.48 |
| | |
|
|
|
L |
|
Royal Bank CA |
115.176 |
8/12/24 |
-0.72 |
98.081 |
|
97.628 |
0.452 |
0.46 |
|
0.61 |
| | |
|
|
|
L |
|
Coca-Cola |
67.859 |
8/12/24 |
-0.74 |
61.060 |
|
52.235 |
8.825 |
16.90 |
|
12.87 |
| | |
|
|
|
L |
|
Amgen |
318.541 |
8/12/24 |
-0.77 |
235.691 |
|
191.337 |
44.353 |
23.18 |
|
11.47 |
| | |
|
|
|
L |
|
Alphabet A |
161.550 |
8/12/24 |
-0.84 |
105.908 |
|
136.955 |
-31.047 |
-22.67 |
|
-14.41 |
| | |
|
|
|
|
|
Merck (MSD) |
112.963 |
8/12/24 |
-0.93 |
84.612 |
|
77.208 |
7.404 |
9.59 |
|
14.49 |
| | |
|
|
|
|
|
IBM |
188.616 |
8/12/24 |
-1.03 |
134.494 |
|
109.664 |
24.830 |
22.64 |
|
8.82 |
| | |
|
|
|
S |
|
Cisco Systems |
44.655 |
8/12/24 |
-1.34 |
43.043 |
|
52.835 |
-9.792 |
-18.53 |
|
-15.45 |
| | |
|
|
|
S |
|
Intel |
19.272 |
8/12/24 |
-1.78 |
37.598 |
|
46.423 |
-8.825 |
-19.01 |
|
-19.69 |
| | |
|
|
|
L |
|
Procter & Gamble |
166.049 |
8/12/24 |
-2.19 |
137.520 |
|
135.984 |
1.536 |
1.13 |
|
-0.28 |
| |
|
⇓instrument |
freshest |
Δday |
6/13/22 |
⇓ Δwk |
11/15/21 |
prc diff |
⇓ Δ30 |
|
⇓∅-RS |
| | |
|
|
|
|
|
Boeing |
163.382 |
8/12/24 |
-2.25 |
115.332 |
|
215.038 |
-99.706 |
-46.37 |
|
-36.92 |
| DJ Global Titans - 50 out of 50 instruments rated - 6/13/22 / 11/15/21 - 23 did rise, Market-Ratio(30) in CHF = 46.00 % |
Technical Chart
Transactions DJ Global Titans 50 in Swiss Franc * A30 - 54/52 (1)
|
⇐ |
| |
| L/S | date buy | date sell | days | | instrument | spl | pieces | | prc buy | prc sell | ps short | prc diff | d % | asset | yield | |
| 1/02/06 |
6/19/06 |
168 |
|
- cash - |
| short |
6/19/06 |
6/26/06 |
7 |
|
|
|
Intel |
100 |
445 |
|
22.459 |
22.837 |
22.081 |
-0.378 |
-2 |
9,832 |
-59 |
|
| long |
6/26/06 |
1/14/08 |
567 |
|
|
|
Gazprom |
100 |
470 |
|
20.875 |
23.566 |
|
2.691 |
13 |
11,097 |
8 |
|
| short |
1/14/08 |
5/04/09 |
476 |
|
|
|
Citigroup |
100 |
34 |
|
320.059 |
36.341 |
2,818.827 |
2,498.768 |
781 |
96,055 |
430 |
|
| long |
5/04/09 |
5/25/09 |
21 |
|
|
|
Qualcomm |
100 |
1,951 |
|
49.230 |
46.992 |
|
-2.239 |
-5 |
91,687 |
-55 |
|
| short |
5/25/09 |
6/01/09 |
7 |
|
|
|
Citigroup |
100 |
2,240 |
|
40.924 |
39.370 |
42.539 |
1.615 |
4 |
95,305 |
653 |
|
| long |
6/01/09 |
6/22/09 |
21 |
|
|
|
Qualcomm |
100 |
2,011 |
|
47.372 |
48.009 |
|
0.637 |
1 |
96,587 |
26 |
|
| short |
6/22/09 |
6/29/09 |
7 |
|
|
|
Citigroup |
100 |
2,977 |
|
32.439 |
32.718 |
32.160 |
-0.279 |
-1 |
95,757 |
-36 |
|
| long |
6/29/09 |
7/06/09 |
7 |
|
|
|
Apple |
100 |
17,432 |
|
5.493 |
5.379 |
|
-0.114 |
-2 |
93,778 |
-66 |
|
| short |
7/06/09 |
7/13/09 |
7 |
|
|
|
Citigroup |
100 |
3,093 |
|
30.319 |
30.206 |
30.433 |
0.114 |
0 |
94,130 |
22 |
|
| long |
7/13/09 |
5/17/10 |
308 |
|
|
|
Apple |
100 |
17,042 |
|
5.523 |
10.298 |
|
4.774 |
86 |
175,493 |
109 |
|
| short |
5/17/10 |
5/31/10 |
14 |
|
|
|
Qualcomm |
100 |
4,141 |
|
42.379 |
40.654 |
44.177 |
1.798 |
4 |
182,938 |
195 |
|
| long |
5/31/10 |
6/07/10 |
7 |
|
|
|
Apple |
100 |
16,940 |
|
10.799 |
10.416 |
|
-0.383 |
-4 |
176,455 |
-85 |
|
| short |
6/07/10 |
9/06/10 |
91 |
|
|
|
Qualcomm |
100 |
4,336 |
|
40.689 |
41.243 |
40.136 |
-0.554 |
-1 |
174,053 |
-5 |
|
| long |
9/06/10 |
9/27/10 |
21 |
|
|
|
Apple |
100 |
18,595 |
|
9.360 |
10.221 |
|
0.861 |
9 |
190,067 |
362 |
|
| short |
9/27/10 |
11/22/10 |
56 |
|
|
|
BP |
100 |
30,251 |
|
6.283 |
6.835 |
5.731 |
-0.552 |
-9 |
173,367 |
-45 |
|
| long |
11/22/10 |
7/25/11 |
245 |
|
|
|
Apple |
100 |
15,611 |
|
11.105 |
11.647 |
|
0.541 |
5 |
181,818 |
7 |
|
| short |
7/25/11 |
12/26/11 |
154 |
|
|
|
Bank of America |
100 |
22,195 |
|
8.192 |
5.137 |
13.062 |
4.871 |
59 |
289,919 |
202 |
|
| long |
12/26/11 |
1/23/12 |
28 |
|
|
|
Philip Morris |
100 |
3,923 |
|
73.898 |
69.984 |
|
-3.915 |
-5 |
274,562 |
-51 |
|
| short |
1/23/12 |
2/06/12 |
14 |
|
|
|
Bank of America |
100 |
40,509 |
|
6.778 |
7.320 |
6.235 |
-0.543 |
-8 |
252,580 |
-89 |
|
| long |
2/06/12 |
5/21/12 |
105 |
|
|
|
Apple |
100 |
16,595 |
|
15.219 |
18.851 |
|
3.632 |
24 |
312,847 |
110 |
|
| short |
5/21/12 |
5/28/12 |
7 |
|
|
|
Telefónica |
100 |
26,534 |
|
11.790 |
11.339 |
12.259 |
0.469 |
4 |
325,281 |
663 |
|
| long |
5/28/12 |
10/22/12 |
147 |
|
|
|
Apple |
100 |
16,605 |
|
19.588 |
21.013 |
|
1.424 |
7 |
348,935 |
19 |
|
| short |
10/22/12 |
10/29/12 |
7 |
|
|
|
Telefónica |
100 |
27,496 |
|
12.690 |
12.180 |
13.222 |
0.532 |
4 |
363,563 |
751 |
|
| long |
10/29/12 |
12/16/13 |
413 |
|
|
|
Bank of America |
100 |
41,727 |
|
8.713 |
13.525 |
|
4.812 |
55 |
564,344 |
47 |
|
| short |
12/16/13 |
12/23/13 |
7 |
|
|
|
IBM |
100 |
3,575 |
|
157.830 |
162.859 |
152.802 |
-5.028 |
-3 |
546,367 |
-82 |
|
| L/S | date buy | date sell | days | | instrument | spl | pieces | | prc buy | prc sell | ps short | prc diff | d % | asset | yield | | | long |
12/23/13 |
10/27/14 |
308 |
|
|
|
Alphabet A |
100 |
21,862 |
|
24.991 |
26.110 |
|
1.119 |
4 |
570,835 |
5 |
|
| short |
10/27/14 |
11/10/14 |
14 |
|
|
|
Samsung Electronics |
100 |
28,887,584 |
|
0.020 |
0.023 |
0.017 |
-0.003 |
-14 |
491,089 |
-98 |
|
| long |
11/10/14 |
12/15/14 |
35 |
|
|
|
Apple |
100 |
18,647 |
|
26.336 |
26.117 |
|
-0.219 |
-1 |
487,003 |
-8 |
|
| short |
12/15/14 |
3/02/15 |
77 |
|
|
|
Gazprom |
100 |
121,515 |
|
4.008 |
4.816 |
3.200 |
-0.808 |
-20 |
388,814 |
-66 |
|
| long |
3/02/15 |
3/30/15 |
28 |
|
|
|
Apple |
100 |
12,574 |
|
30.922 |
30.560 |
|
-0.362 |
-1 |
384,261 |
-14 |
|
| short |
3/30/15 |
4/27/15 |
28 |
|
|
|
ConocoPhilips |
100 |
6,206 |
|
61.908 |
64.054 |
59.762 |
-2.146 |
-3 |
370,942 |
-37 |
|
| long |
4/27/15 |
6/08/15 |
42 |
|
|
|
Mitsubishi UFJ |
100 |
5,497,037 |
|
0.067 |
0.067 |
|
-0.001 |
-1 |
366,924 |
-9 |
|
| short |
6/08/15 |
7/13/15 |
35 |
|
|
|
BHP |
100 |
18,418 |
|
19.921 |
18.596 |
21.341 |
1.419 |
7 |
393,068 |
105 |
|
| long |
7/13/15 |
7/27/15 |
14 |
|
|
|
Mitsubishi UFJ |
100 |
5,985,327 |
|
0.066 |
0.069 |
|
0.003 |
5 |
411,350 |
227 |
|
| short |
7/27/15 |
8/03/15 |
7 |
|
|
|
ConocoPhilips |
100 |
8,436 |
|
48.760 |
48.176 |
49.351 |
0.591 |
1 |
416,335 |
87 |
|
| long |
8/03/15 |
8/24/15 |
21 |
|
|
|
Mitsubishi UFJ |
100 |
6,047,259 |
|
0.069 |
0.058 |
|
-0.011 |
-15 |
352,232 |
-95 |
|
| short |
8/24/15 |
3/21/16 |
210 |
|
|
|
ConocoPhilips |
100 |
8,813 |
|
39.964 |
41.322 |
38.607 |
-1.358 |
-3 |
340,266 |
-6 |
|
| long |
3/21/16 |
3/28/16 |
7 |
|
|
|
McDonald´s |
100 |
2,831 |
|
120.153 |
119.935 |
|
-0.217 |
0 |
339,651 |
-9 |
|
| short |
3/28/16 |
4/11/16 |
14 |
|
|
|
Mitsubishi UFJ |
100 |
7,493,799 |
|
0.045 |
0.042 |
0.049 |
0.004 |
8 |
367,946 |
705 |
|
| long |
4/11/16 |
5/09/16 |
28 |
|
|
|
McDonald´s |
100 |
3,021 |
|
121.779 |
127.059 |
|
5.281 |
4 |
383,899 |
74 |
|
| short |
5/09/16 |
7/04/16 |
56 |
|
|
|
Mitsubishi UFJ |
100 |
8,637,118 |
|
0.044 |
0.043 |
0.046 |
0.001 |
3 |
395,580 |
22 |
|
| long |
7/04/16 |
3/05/18 |
609 |
|
|
|
BP |
100 |
68,733 |
|
5.755 |
6.119 |
|
0.364 |
6 |
420,573 |
4 |
|
| short |
3/05/18 |
3/12/18 |
7 |
|
|
|
General Electric |
100 |
3,878 |
|
108.449 |
114.510 |
102.388 |
-6.061 |
-6 |
397,069 |
-95 |
|
| long |
3/12/18 |
4/09/18 |
28 |
|
|
|
Intel |
100 |
8,130 |
|
48.837 |
47.399 |
|
-1.438 |
-3 |
385,376 |
-32 |
|
| short |
4/09/18 |
9/03/18 |
147 |
|
|
|
General Electric |
100 |
3,925 |
|
98.184 |
100.324 |
96.045 |
-2.139 |
-2 |
376,979 |
-5 |
|
| long |
9/03/18 |
11/26/18 |
84 |
|
|
|
Apple |
100 |
6,835 |
|
55.151 |
43.564 |
|
-11.586 |
-21 |
297,786 |
-64 |
|
| short |
11/26/18 |
4/01/19 |
126 |
|
|
|
General Electric |
100 |
4,920 |
|
60.514 |
80.691 |
40.337 |
-20.177 |
-33 |
198,514 |
-69 |
|
| long |
4/01/19 |
4/22/19 |
21 |
|
|
|
Procter & Gamble |
100 |
1,917 |
|
103.500 |
107.625 |
|
4.125 |
4 |
206,421 |
97 |
|
| short |
4/22/19 |
4/29/19 |
7 |
|
|
|
Schlumberger |
100 |
4,434 |
|
46.549 |
44.274 |
48.940 |
2.391 |
5 |
217,023 |
1,263 |
|
| long |
4/29/19 |
6/03/19 |
35 |
|
|
|
Qualcomm |
100 |
2,439 |
|
88.946 |
66.211 |
|
-22.735 |
-26 |
161,571 |
-95 |
|
| L/S | date buy | date sell | days | | instrument | spl | pieces | | prc buy | prc sell | ps short | prc diff | d % | asset | yield | | | short |
6/03/19 |
6/10/19 |
7 |
|
|
|
Schlumberger |
100 |
4,583 |
|
35.251 |
35.092 |
35.410 |
0.159 |
0 |
162,301 |
26 |
|
| long |
6/10/19 |
2/24/20 |
259 |
|
|
|
Gazprom |
100 |
23,155 |
|
7.009 |
6.719 |
|
-0.290 |
-4 |
155,582 |
-6 |
|
| short |
2/24/20 |
10/05/20 |
224 |
|
|
|
Exxon Mobil |
100 |
2,820 |
|
55.154 |
30.878 |
98.516 |
43.362 |
79 |
277,862 |
157 |
|
| long |
10/05/20 |
3/07/22 |
518 |
|
|
|
Apple |
100 |
2,606 |
|
106.619 |
147.517 |
|
40.898 |
38 |
384,443 |
26 |
|
| short |
3/07/22 |
3/28/22 |
21 |
|
|
|
Gazprom |
100 |
141,351 |
|
2.720 |
2.773 |
2.666 |
-0.054 |
-2 |
376,858 |
-29 |
|
| long |
3/28/22 |
6/13/22 |
77 |
|
|
|
ConocoPhilips |
100 |
3,894 |
|
96.756 |
111.250 |
|
14.495 |
15 |
433,301 |
94 |
|
| short |
6/13/22 |
1/09/23 |
210 |
|
|
|
General Electric |
100 |
6,427 |
|
67.411 |
66.804 |
68.024 |
0.613 |
1 |
437,241 |
2 |
|
| long |
1/09/23 |
3/13/23 |
63 |
|
|
|
Schlumberger |
100 |
8,548 |
|
51.148 |
44.469 |
|
-6.679 |
-13 |
380,149 |
-56 |
|
| short |
3/13/23 |
3/27/23 |
14 |
|
|
|
3M |
100 |
4,033 |
|
94.238 |
92.934 |
95.560 |
1.322 |
1 |
385,481 |
44 |
|
| long |
3/27/23 |
10/30/23 |
217 |
|
|
|
NVidia |
100 |
15,867 |
|
24.294 |
37.133 |
|
12.838 |
53 |
589,188 |
104 |
|
| short |
10/30/23 |
12/04/23 |
35 |
|
|
|
Pfizer |
100 |
21,378 |
|
27.560 |
25.542 |
29.738 |
2.178 |
8 |
635,747 |
121 |
|
| long |
12/04/23 |
8/12/24 |
252 |
|
|
|
NVidia |
100 |
16,013 |
|
39.700 |
98.514 |
|
58.814 |
148 |
1,577,533 |
273 |
|
| accum | 6/19/06 |
8/12/24 | 7226 |
days out of 7394 invested (98%) |
15,675 |
1,577,533 |
29 |
|
Instrument Related Contribution
| instrument | L/S | date buy | date sell | days | prc buy | prc sell | ps short | prc diff | d % | | | total |
| Citigroup | short | 1/14/08 | 5/04/09 | 476 | 320.06 | 36.34 | 2,818.83 | 2,498.77 | 780.72 | | | |
| | short | 5/25/09 | 6/01/09 | 7 | 40.92 | 39.37 | 42.54 | 1.62 | 3.95 | | | |
| | short | 6/22/09 | 6/29/09 | 7 | 32.44 | 32.72 | 32.16 | -0.28 | -0.86 | | | |
| | short | 7/06/09 | 7/13/09 | 7 | 30.32 | 30.21 | 30.43 | 0.11 | 0.38 | | | 811.01 |
| NVidia | long | 3/27/23 | 10/30/23 | 217 | 24.29 | 37.13 | | 12.84 | 52.84 | | | |
| | long | 12/04/23 | 8/12/24 | 252 | 39.70 | 98.51 | | 58.81 | 148.15 | | | 279.28 |
| Apple | long | 6/29/09 | 7/06/09 | 7 | 5.49 | 5.38 | | -0.11 | -2.07 | | | |
| | long | 7/13/09 | 5/17/10 | 308 | 5.52 | 10.30 | | 4.77 | 86.44 | | | |
| | long | 5/31/10 | 6/07/10 | 7 | 10.80 | 10.42 | | -0.38 | -3.54 | | | |
| | long | 9/06/10 | 9/27/10 | 21 | 9.36 | 10.22 | | 0.86 | 9.20 | | | |
| | long | 11/22/10 | 7/25/11 | 245 | 11.11 | 11.65 | | 0.54 | 4.87 | | | |
| | long | 2/06/12 | 5/21/12 | 105 | 15.22 | 18.85 | | 3.63 | 23.86 | | | |
| | long | 5/28/12 | 10/22/12 | 147 | 19.59 | 21.01 | | 1.42 | 7.27 | | | |
| | long | 11/10/14 | 12/15/14 | 35 | 26.34 | 26.12 | | -0.22 | -0.83 | | | |
| | long | 3/02/15 | 3/30/15 | 28 | 30.92 | 30.56 | | -0.36 | -1.17 | | | |
| | long | 9/03/18 | 11/26/18 | 84 | 55.15 | 43.56 | | -11.59 | -21.01 | | | |
| | long | 10/05/20 | 3/07/22 | 518 | 106.62 | 147.52 | | 40.90 | 38.36 | | | 187.05 |
| Bank of America | short | 7/25/11 | 12/26/11 | 154 | 8.19 | 5.14 | 13.06 | 4.87 | 59.46 | | | |
| | short | 1/23/12 | 2/06/12 | 14 | 6.78 | 7.32 | 6.24 | -0.54 | -8.01 | | | |
| | long | 10/29/12 | 12/16/13 | 413 | 8.71 | 13.52 | | 4.81 | 55.23 | | | 127.70 |
| Exxon Mobil | short | 2/24/20 | 10/05/20 | 224 | 55.15 | 30.88 | 98.52 | 43.36 | 78.62 | | | 78.62 |
| ConocoPhilips | short | 3/30/15 | 4/27/15 | 28 | 61.91 | 64.05 | 59.76 | -2.15 | -3.47 | | | |
| | short | 7/27/15 | 8/03/15 | 7 | 48.76 | 48.18 | 49.35 | 0.59 | 1.21 | | | |
| | short | 8/24/15 | 3/21/16 | 210 | 39.96 | 41.32 | 38.61 | -1.36 | -3.40 | | | |
| | long | 3/28/22 | 6/13/22 | 77 | 96.76 | 111.25 | | 14.49 | 14.98 | | | 8.52 |
| instrument | L/S | date buy | date sell | days | prc buy | prc sell | ps short | prc diff | d % | | | total |
| Telefónica | short | 5/21/12 | 5/28/12 | 7 | 11.79 | 11.34 | 12.26 | 0.47 | 3.97 | | | |
| | short | 10/22/12 | 10/29/12 | 7 | 12.69 | 12.18 | 13.22 | 0.53 | 4.19 | | | 8.33 |
| Pfizer | short | 10/30/23 | 12/04/23 | 35 | 27.56 | 25.54 | 29.74 | 2.18 | 7.90 | | | 7.90 |
| BHP | short | 6/08/15 | 7/13/15 | 35 | 19.92 | 18.60 | 21.34 | 1.42 | 7.13 | | | 7.13 |
| Alphabet A | long | 12/23/13 | 10/27/14 | 308 | 24.99 | 26.11 | | 1.12 | 4.48 | | | 4.48 |
| McDonald´s | long | 3/21/16 | 3/28/16 | 7 | 120.15 | 119.94 | | -0.22 | -0.18 | | | |
| | long | 4/11/16 | 5/09/16 | 28 | 121.78 | 127.06 | | 5.28 | 4.34 | | | 4.15 |
| Procter & Gamble | long | 4/01/19 | 4/22/19 | 21 | 103.50 | 107.63 | | 4.12 | 3.99 | | | 3.99 |
| 3M | short | 3/13/23 | 3/27/23 | 14 | 94.24 | 92.93 | 95.56 | 1.32 | 1.40 | | | 1.40 |
| Mitsubishi UFJ | long | 4/27/15 | 6/08/15 | 42 | 0.07 | 0.07 | | -0.00 | -1.08 | | | |
| | long | 7/13/15 | 7/27/15 | 14 | 0.07 | 0.07 | | 0.00 | 4.65 | | | |
| | long | 8/03/15 | 8/24/15 | 21 | 0.07 | 0.06 | | -0.01 | -15.40 | | | |
| | short | 3/28/16 | 4/11/16 | 14 | 0.05 | 0.04 | 0.05 | 0.00 | 8.33 | | | |
| | short | 5/09/16 | 7/04/16 | 56 | 0.04 | 0.04 | 0.05 | 0.00 | 3.04 | | | -2.24 |
| BP | short | 9/27/10 | 11/22/10 | 56 | 6.28 | 6.83 | 5.73 | -0.55 | -8.79 | | | |
| | long | 7/04/16 | 3/05/18 | 609 | 5.76 | 6.12 | | 0.36 | 6.32 | | | -3.02 |
| IBM | short | 12/16/13 | 12/23/13 | 7 | 157.83 | 162.86 | 152.80 | -5.03 | -3.19 | | | -3.19 |
| Intel | short | 6/19/06 | 6/26/06 | 7 | 22.46 | 22.84 | 22.08 | -0.38 | -1.68 | | | |
| | long | 3/12/18 | 4/09/18 | 28 | 48.84 | 47.40 | | -1.44 | -2.94 | | | -4.58 |
| Philip Morris | long | 12/26/11 | 1/23/12 | 28 | 73.90 | 69.98 | | -3.91 | -5.30 | | | -5.30 |
| Schlumberger | short | 4/22/19 | 4/29/19 | 7 | 46.55 | 44.27 | 48.94 | 2.39 | 5.14 | | | |
| | short | 6/03/19 | 6/10/19 | 7 | 35.25 | 35.09 | 35.41 | 0.16 | 0.45 | | | |
| | long | 1/09/23 | 3/13/23 | 63 | 51.15 | 44.47 | | -6.68 | -13.06 | | | -8.18 |
| Samsung Electronics | short | 10/27/14 | 11/10/14 | 14 | 0.02 | 0.02 | 0.02 | -0.00 | -13.97 | | | -13.97 |
| Gazprom | long | 6/26/06 | 1/14/08 | 567 | 20.88 | 23.57 | | 2.69 | 12.89 | | | |
| | short | 12/15/14 | 3/02/15 | 77 | 4.01 | 4.82 | 3.20 | -0.81 | -20.16 | | | |
| | long | 6/10/19 | 2/24/20 | 259 | 7.01 | 6.72 | | -0.29 | -4.14 | | | |
| | short | 3/07/22 | 3/28/22 | 21 | 2.72 | 2.77 | 2.67 | -0.05 | -1.97 | | | -15.31 |
| instrument | L/S | date buy | date sell | days | prc buy | prc sell | ps short | prc diff | d % | | | total |
| Qualcomm | long | 5/04/09 | 5/25/09 | 21 | 49.23 | 46.99 | | -2.24 | -4.55 | | | |
| | long | 6/01/09 | 6/22/09 | 21 | 47.37 | 48.01 | | 0.64 | 1.35 | | | |
| | short | 5/17/10 | 5/31/10 | 14 | 42.38 | 40.65 | 44.18 | 1.80 | 4.24 | | | |
| | short | 6/07/10 | 9/06/10 | 91 | 40.69 | 41.24 | 40.14 | -0.55 | -1.36 | | | |
| | long | 4/29/19 | 6/03/19 | 35 | 88.95 | 66.21 | | -22.74 | -25.56 | | | -25.96 |
| General Electric | short | 3/05/18 | 3/12/18 | 7 | 108.45 | 114.51 | 102.39 | -6.06 | -5.59 | | | |
| | short | 4/09/18 | 9/03/18 | 147 | 98.18 | 100.32 | 96.04 | -2.14 | -2.18 | | | |
| | short | 11/26/18 | 4/01/19 | 126 | 60.51 | 80.69 | 40.34 | -20.18 | -33.34 | | | |
| | short | 6/13/22 | 1/09/23 | 210 | 67.41 | 66.80 | 68.02 | 0.61 | 0.91 | | | -37.88 |
Annotations
| 6/10/24 | NVidia | | | stock split 1:10 (ten for one) |
| 2/26/24 | Walmart | | | stock split 1:3 (three for one) |
| 7/18/22 | Alphabet A | | | stock split 1:20 (twenty for one) |
| | GlaxoSmithKline | | | demergers OTC business -> Haleon |
| 6/06/22 | Amazon.com | | | stock split 1:20 (twenty for one) |
| 9/29/21 | Toyota | | | stock split 1:5 (five for one) |
| 8/02/21 | General Electric | | | reverse stock split 8:1 (eight become one) |
| 7/20/21 | NVidia | | | stock split 1:4 (four for one) |
| 5/04/18 | Samsung Electronics | | | stock split 1:50 (fifty for one) |
| 10/04/16 | AB InBev | | | acquisition of SAB Miller completed |
| 10/02/15 | Google A | | | changes name to Alphabet |
| 3/19/15 | Visa | | | forward stock split 1:4 (four for one) |
|
|