| | Wed, Apr 1st, 2026, 14:11UTC |
| | |

Assessment - Mining - 3/26/07 - RS = 26
⇐
| |
|
⇓instrument |
freshest |
⇓ Δday |
3/26/07 |
⇓ Δwk |
9/25/06 |
prc diff |
Δ26 |
Curr |
⇓∅-RS |
| |  |
 |
 |
|
L |
 |
SOM Mining |
1,335.670 |
8/12/24 |
1.24 |
277.173 |
|
215.805 |
61.368 |
28.44 |
USD |
16.99 |
| | |
|
|
|
|
|
Fortescue Metals |
18.240 |
8/12/24 |
-1.35 |
2.000 |
|
0.800 |
1.200 |
150.00 |
AUD |
101.75 |
| | |
|
|
|
|
|
Mineral Resources |
49.740 |
8/12/24 |
-3.79 |
2.780 |
|
1.400 |
1.380 |
98.57 |
AUD |
-na- |
| | |
|
|
|
|
|
México |
106.190 |
8/12/24 |
1.09 |
16.290 |
|
10.960 |
5.330 |
48.63 |
MXN |
34.23 |
| | |
|
|
|
L |
|
First Quantum |
15.960 |
8/12/24 |
2.77 |
15.050 |
|
10.220 |
4.830 |
47.26 |
CAD |
35.27 |
| | |
|
|
|
L |
|
Eramet |
72.350 |
8/12/24 |
5.24 |
153.010 |
|
109.300 |
43.710 |
39.99 |
EUR |
28.25 |
| | |
|
|
|
|
|
Eldorado Gold |
23.270 |
8/12/24 |
4.82 |
33.750 |
|
24.250 |
9.500 |
39.18 |
CAD |
19.64 |
| | |
|
|
|
L |
|
Anglo American |
2,232.500 |
8/12/24 |
0.29 |
2,617.000 |
|
2,060.000 |
557.000 |
27.04 |
GBP |
12.99 |
| | |
|
|
|
|
|
Antofagasta |
1,879.500 |
8/12/24 |
1.79 |
508.500 |
|
420.250 |
88.250 |
21.00 |
GBP |
11.70 |
| | |
|
|
|
|
|
Rio Tinto |
4,942.000 |
8/12/24 |
0.56 |
2,350.260 |
|
1,943.000 |
407.260 |
20.96 |
GBP |
2.91 |
| | |
|
|
|
|
|
Agnico-Eagle Mines |
105.450 |
8/12/24 |
3.52 |
40.570 |
|
34.290 |
6.280 |
18.31 |
CAD |
1.43 |
| | |
|
|
|
|
|
BHP |
40.640 |
8/12/24 |
-0.54 |
29.470 |
|
25.100 |
4.370 |
17.41 |
AUD |
10.38 |
| | |
|
|
|
|
|
Cameco |
53.730 |
8/12/24 |
-1.09 |
46.430 |
|
39.900 |
6.530 |
16.37 |
CAD |
8.70 |
| | |
|
|
|
|
|
Teck Resources |
63.820 |
8/12/24 |
2.36 |
38.840 |
|
33.410 |
5.430 |
16.25 |
CAD |
6.26 |
| | |
|
|
|
L |
|
Kinross Gold |
12.250 |
8/12/24 |
5.15 |
15.800 |
|
13.870 |
1.930 |
13.91 |
CAD |
17.40 |
| | |
|
|
|
|
|
Mitsui Ming & Smltg |
4,205.000 |
8/09/24 |
6.64 |
6,860.000 |
|
6,030.000 |
830.000 |
13.76 |
JPY |
5.45 |
| | |
|
|
|
|
|
Boliden |
305.000 |
8/12/24 |
1.33 |
154.000 |
|
139.000 |
15.000 |
10.79 |
SEK |
7.31 |
| | |
|
|
|
L |
|
Wheaton Precious |
78.610 |
8/12/24 |
2.56 |
10.930 |
|
10.490 |
0.440 |
4.19 |
CAD |
-2.31 |
| | |
|
|
|
|
|
Coal India |
523.950 |
8/12/24 |
-1.10 |
|
|
|
|
|
INR |
-na- |
| | |
|
|
|
|
|
Endeavour Mining |
1,567.000 |
8/12/24 |
1.89 |
|
|
|
|
|
GBP |
-na- |
| | |
|
|
|
|
|
Franco-Nevada |
170.330 |
8/12/24 |
2.47 |
|
|
|
|
|
CAD |
-na- |
| | |
|
|
|
|
|
Fresnillo |
540.000 |
8/12/24 |
0.93 |
|
|
|
|
|
GBP |
-na- |
| | |
|
|
|
|
|
Glencore |
410.250 |
8/12/24 |
1.27 |
|
|
|
|
|
GBP |
-na- |
| | |
|
|
|
|
|
Peñoles |
241.670 |
8/12/24 |
-0.26 |
|
|
|
|
|
MXN |
-na- |
| | |
|
|
|
S |
|
Pilbara Minerals |
2.980 |
8/12/24 |
-2.93 |
|
|
|
|
|
AUD |
-na- |
| |
|
⇓instrument |
freshest |
⇓ Δday |
3/26/07 |
⇓ Δwk |
9/25/06 |
prc diff |
Δ26 |
Curr |
⇓∅-RS |
| | |
|
|
|
L |
|
SOUTH32 |
2.930 |
8/12/24 |
-0.34 |
|
|
|
|
|
AUD |
-na- |
| | |
|
|
|
|
|
Sumitomo Metal |
3,642.000 |
8/09/24 |
1.59 |
|
|
|
|
|
JPY |
-na- |
| | |
|
|
|
|
|
Zhejiang Huayou |
22.260 |
8/12/24 |
-0.27 |
|
|
|
|
|
CNY |
-na- |
| | |
|
|
|
|
|
Zijin Mining |
15.360 |
8/12/24 |
0.13 |
|
|
|
|
|
CNY |
-na- |
| | |
|
|
|
|
|
Barrick Gold |
26.150 |
8/12/24 |
9.37 |
32.030 |
|
33.260 |
-1.230 |
-3.70 |
CAD |
-3.19 |
| Mining - 18 out of 29 instruments rated - 3/26/07 / 9/25/06 - 17 did rise, Market-Ratio(26) = 94.44 % |
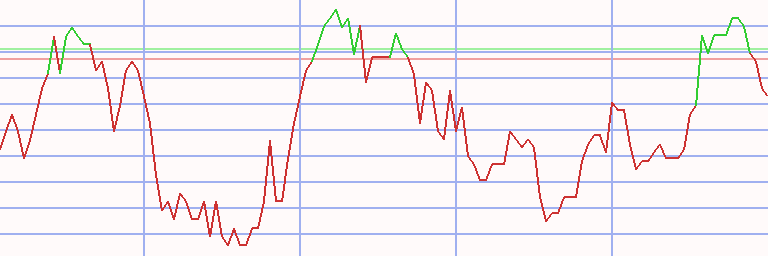
Technical Chart
Transactions Mining * A26 - 81/77 (1)
|
⇐ |
| |
| L/S | date buy | date sell | days | | instrument | spl | pieces | Curr | prc buy | prc sell | ps short | prc diff | d % | asset | yield | |
| 1/02/06 |
7/17/06 |
196 |
|
- cash - |
| short |
7/17/06 |
8/07/06 |
21 |
|
|
|
Mitsui Ming & Smltg |
100 |
154 |
JPY |
64.800 |
60.900 |
68.950 |
4.150 |
6 |
10,639 |
194 |
|
| long |
8/07/06 |
8/28/06 |
21 |
|
|
|
Boliden |
100 |
82 |
SEK |
128.500 |
138.000 |
|
9.500 |
7 |
11,418 |
245 |
|
| short |
8/28/06 |
9/04/06 |
7 |
|
|
|
Mitsui Ming & Smltg |
100 |
168 |
JPY |
67.900 |
69.300 |
66.500 |
-1.400 |
-2 |
11,183 |
-66 |
|
| long |
9/04/06 |
9/11/06 |
7 |
|
|
|
Boliden |
100 |
79 |
SEK |
141.500 |
141.000 |
|
-0.500 |
0 |
11,143 |
-17 |
|
| short |
9/11/06 |
12/04/06 |
84 |
|
|
|
Mitsui Ming & Smltg |
100 |
172 |
JPY |
64.600 |
55.400 |
75.328 |
10.728 |
17 |
12,989 |
95 |
|
| long |
12/04/06 |
1/08/07 |
35 |
|
|
|
Boliden |
100 |
76 |
SEK |
169.000 |
161.500 |
|
-7.500 |
-4 |
12,419 |
-38 |
|
| short |
1/08/07 |
2/05/07 |
28 |
|
|
|
Mitsui Ming & Smltg |
100 |
217 |
JPY |
57.200 |
63.000 |
51.400 |
-5.800 |
-10 |
11,160 |
-75 |
|
| long |
2/05/07 |
2/26/07 |
21 |
|
|
|
Vedanta |
100 |
604 |
INR |
18.475 |
19.959 |
|
1.484 |
8 |
12,056 |
283 |
|
| short |
2/26/07 |
3/12/07 |
14 |
|
|
|
Goldcorp |
100 |
410 |
CAD |
29.370 |
27.690 |
31.152 |
1.782 |
6 |
12,787 |
364 |
|
| long |
3/12/07 |
4/30/07 |
49 |
|
|
|
Yamana Gold |
100 |
783 |
CAD |
16.330 |
15.620 |
|
-0.710 |
-4 |
12,231 |
-28 |
|
| short |
4/30/07 |
10/22/07 |
175 |
|
|
|
Mitsui Ming & Smltg |
100 |
205 |
JPY |
59.600 |
49.600 |
71.616 |
12.016 |
20 |
14,694 |
47 |
|
| long |
10/22/07 |
11/05/07 |
14 |
|
|
|
China Shenhua HK |
100 |
316 |
HKD |
46.360 |
43.980 |
|
-2.380 |
-5 |
13,942 |
-75 |
|
| short |
11/05/07 |
2/18/08 |
105 |
|
|
|
Boliden |
100 |
139 |
SEK |
100.250 |
67.000 |
150.001 |
49.751 |
50 |
20,858 |
306 |
|
| long |
2/18/08 |
3/10/08 |
21 |
|
|
|
Eramet |
100 |
49 |
EUR |
419.750 |
475.220 |
|
55.470 |
13 |
23,576 |
765 |
|
| short |
3/10/08 |
4/20/09 |
406 |
|
|
|
Boliden |
100 |
377 |
SEK |
62.500 |
56.500 |
69.137 |
6.637 |
11 |
26,078 |
9 |
|
| long |
4/20/09 |
8/10/09 |
112 |
|
|
|
Boliden |
100 |
461 |
SEK |
56.500 |
79.000 |
|
22.500 |
40 |
36,450 |
198 |
|
| short |
8/10/09 |
8/24/09 |
14 |
|
|
|
Barrick Gold |
100 |
974 |
CAD |
37.400 |
38.730 |
36.070 |
-1.330 |
-4 |
35,155 |
-61 |
|
| long |
8/24/09 |
2/01/10 |
161 |
|
|
|
Teck Resources |
100 |
1,276 |
CAD |
27.550 |
36.860 |
|
9.310 |
34 |
47,034 |
93 |
|
| short |
2/01/10 |
2/08/10 |
7 |
|
|
|
Kinross Gold |
100 |
2,546 |
CAD |
18.470 |
19.300 |
17.640 |
-0.830 |
-4 |
44,921 |
-91 |
|
| long |
2/08/10 |
2/22/10 |
14 |
|
|
|
Teck Resources |
100 |
1,186 |
CAD |
37.870 |
39.720 |
|
1.850 |
5 |
47,115 |
247 |
|
| short |
2/22/10 |
10/18/10 |
238 |
|
|
|
Kinross Gold |
100 |
2,470 |
CAD |
19.070 |
18.280 |
19.894 |
0.824 |
4 |
49,151 |
7 |
|
| long |
10/18/10 |
4/11/11 |
175 |
|
|
|
Wheaton Precious |
100 |
1,822 |
CAD |
26.970 |
40.900 |
|
13.930 |
52 |
74,531 |
138 |
|
| short |
4/11/11 |
12/17/12 |
616 |
|
|
|
Kinross Gold |
100 |
4,955 |
CAD |
15.040 |
9.570 |
23.637 |
8.597 |
57 |
117,127 |
31 |
|
| long |
12/17/12 |
12/31/12 |
14 |
|
|
|
Agnico-Eagle Mines |
100 |
2,243 |
CAD |
52.210 |
50.390 |
|
-1.820 |
-3 |
113,045 |
-60 |
|
| short |
12/31/12 |
1/14/13 |
14 |
|
|
|
Newcrest Mining |
100 |
4,949 |
AUD |
22.840 |
23.000 |
22.680 |
-0.160 |
-1 |
112,253 |
-17 |
|
| L/S | date buy | date sell | days | | instrument | spl | pieces | Curr | prc buy | prc sell | ps short | prc diff | d % | asset | yield | | | long |
1/14/13 |
2/04/13 |
21 |
|
|
|
Agnico-Eagle Mines |
100 |
2,239 |
CAD |
50.120 |
45.320 |
|
-4.800 |
-10 |
101,506 |
-83 |
|
| short |
2/04/13 |
6/13/16 |
1225 |
|
|
|
Barrick Gold |
100 |
3,115 |
CAD |
32.580 |
25.900 |
40.983 |
8.403 |
26 |
127,681 |
7 |
|
| long |
6/13/16 |
6/27/16 |
14 |
|
|
|
Kinross Gold |
100 |
19,345 |
CAD |
6.600 |
6.740 |
|
0.140 |
2 |
130,389 |
73 |
|
| short |
6/27/16 |
7/04/16 |
7 |
|
|
|
Sumitomo Metal |
100 |
6,496 |
JPY |
20.070 |
21.800 |
18.340 |
-1.730 |
-9 |
119,151 |
-99 |
|
| long |
7/04/16 |
10/10/16 |
98 |
|
|
|
Fresnillo |
100 |
6,245 |
GBP |
19.077 |
16.850 |
|
-2.227 |
-12 |
105,243 |
-37 |
|
| short |
10/10/16 |
10/24/16 |
14 |
|
|
|
Cameco |
100 |
10,051 |
CAD |
10.470 |
10.390 |
10.551 |
0.081 |
1 |
106,053 |
22 |
|
| long |
10/24/16 |
11/14/16 |
21 |
|
|
|
Teck Resources |
100 |
3,862 |
CAD |
27.460 |
31.010 |
|
3.550 |
13 |
119,764 |
727 |
|
| short |
11/14/16 |
4/10/17 |
147 |
|
|
|
Cameco |
100 |
11,593 |
CAD |
10.330 |
15.470 |
5.190 |
-5.140 |
-50 |
60,176 |
-82 |
|
| long |
4/10/17 |
5/01/17 |
21 |
|
|
|
Glencore |
100 |
18,880 |
GBP |
3.187 |
3.047 |
|
-0.140 |
-4 |
57,527 |
-54 |
|
| short |
5/01/17 |
1/08/18 |
252 |
|
|
|
Yamana Gold |
100 |
16,113 |
CAD |
3.570 |
3.940 |
3.200 |
-0.370 |
-10 |
51,565 |
-15 |
|
| long |
1/08/18 |
2/05/18 |
28 |
|
|
|
Sumitomo Metal |
100 |
939 |
JPY |
54.900 |
49.930 |
|
-4.970 |
-9 |
46,898 |
-71 |
|
| short |
2/05/18 |
6/24/19 |
504 |
|
|
|
Eldorado Gold |
100 |
6,170 |
CAD |
7.600 |
7.220 |
8.000 |
0.400 |
5 |
49,366 |
4 |
|
| long |
6/24/19 |
7/08/19 |
14 |
|
|
|
Fortescue Metals |
100 |
5,597 |
AUD |
8.820 |
8.850 |
|
0.030 |
0 |
49,534 |
9 |
|
| short |
7/08/19 |
9/07/20 |
427 |
|
|
|
First Quantum |
100 |
4,288 |
CAD |
11.550 |
12.930 |
10.170 |
-1.380 |
-12 |
43,616 |
-10 |
|
| long |
9/07/20 |
10/26/20 |
49 |
|
|
|
Fresnillo |
100 |
3,306 |
GBP |
13.190 |
12.180 |
|
-1.010 |
-8 |
40,277 |
-45 |
|
| short |
10/26/20 |
12/07/20 |
42 |
|
|
|
Eramet |
100 |
1,693 |
EUR |
23.780 |
40.000 |
7.560 |
-16.220 |
-68 |
12,817 |
-100 |
|
| long |
12/07/20 |
12/14/20 |
7 |
|
|
|
First Quantum |
100 |
651 |
CAD |
19.670 |
20.420 |
|
0.750 |
4 |
13,305 |
604 |
|
| short |
12/14/20 |
1/04/21 |
21 |
|
|
|
Shandong Gold |
100 |
565 |
CNY |
23.530 |
24.170 |
22.890 |
-0.640 |
-3 |
12,944 |
-38 |
|
| long |
1/04/21 |
1/11/21 |
7 |
|
|
|
First Quantum |
100 |
521 |
CAD |
24.810 |
24.680 |
|
-0.130 |
-1 |
12,876 |
-24 |
|
| short |
1/11/21 |
5/24/21 |
133 |
|
|
|
Shandong Gold |
100 |
550 |
CNY |
23.390 |
21.120 |
25.904 |
2.514 |
11 |
14,259 |
32 |
|
| long |
5/24/21 |
6/07/21 |
14 |
|
|
|
First Quantum |
100 |
521 |
CAD |
27.340 |
29.070 |
|
1.730 |
6 |
15,160 |
395 |
|
| short |
6/07/21 |
3/07/22 |
273 |
|
|
|
Shandong Gold |
100 |
743 |
CNY |
20.400 |
21.130 |
19.670 |
-0.730 |
-4 |
14,618 |
-5 |
|
| long |
3/07/22 |
3/14/22 |
7 |
|
|
|
Eramet |
100 |
114 |
EUR |
127.600 |
124.900 |
|
-2.700 |
-2 |
14,310 |
-67 |
|
| short |
3/14/22 |
3/21/22 |
7 |
|
|
|
Norilsk Nickel |
100 |
1,515 |
EUR |
9.440 |
9.440 |
9.440 |
0.000 |
0 |
14,310 |
0 |
|
| long |
3/21/22 |
4/25/22 |
35 |
|
|
|
Eramet |
100 |
100 |
EUR |
142.800 |
131.300 |
|
-11.500 |
-8 |
13,160 |
-58 |
|
| L/S | date buy | date sell | days | | instrument | spl | pieces | Curr | prc buy | prc sell | ps short | prc diff | d % | asset | yield | | | short |
4/25/22 |
1/09/23 |
259 |
|
|
|
Norilsk Nickel |
100 |
1,394 |
EUR |
9.440 |
9.440 |
9.440 |
0.000 |
0 |
13,160 |
0 |
|
| long |
1/09/23 |
3/13/23 |
63 |
|
|
|
Peñoles |
100 |
45 |
MXN |
291.300 |
236.590 |
|
-54.710 |
-19 |
10,698 |
-70 |
|
| short |
3/13/23 |
4/17/23 |
35 |
|
|
|
Zhejiang Huayou |
100 |
189 |
CNY |
56.550 |
56.100 |
57.004 |
0.454 |
1 |
10,784 |
9 |
|
| long |
4/17/23 |
5/08/23 |
21 |
|
|
|
Eldorado Gold |
100 |
719 |
CAD |
14.980 |
15.960 |
|
0.980 |
7 |
11,488 |
201 |
|
| short |
5/08/23 |
4/08/24 |
336 |
|
|
|
Zhejiang Huayou |
100 |
218 |
CNY |
52.670 |
30.950 |
89.633 |
36.963 |
70 |
19,546 |
78 |
|
| long |
4/08/24 |
6/10/24 |
63 |
|
|
|
Coal India |
100 |
436 |
INR |
44.740 |
47.770 |
|
3.030 |
7 |
20,867 |
46 |
|
| short |
6/10/24 |
8/12/24 |
63 |
|
|
|
Zhejiang Huayou |
100 |
789 |
CNY |
26.430 |
22.260 |
31.381 |
4.951 |
19 |
24,774 |
170 |
|
| accum | 7/17/06 |
8/12/24 | 7198 |
days out of 7394 invested (97%) |
148 |
24,774 |
5 |
|
Instrument Related Contribution
| instrument | L/S | date buy | date sell | days | prc buy | prc sell | ps short | prc diff | d % | | | total |
| Boliden | long | 8/07/06 | 8/28/06 | 21 | 128.50 | 138.00 | | 9.50 | 7.39 | | | |
| | long | 9/04/06 | 9/11/06 | 7 | 141.50 | 141.00 | | -0.50 | -0.35 | | | |
| | long | 12/04/06 | 1/08/07 | 35 | 169.00 | 161.50 | | -7.50 | -4.44 | | | |
| | short | 11/05/07 | 2/18/08 | 105 | 100.25 | 67.00 | 150.00 | 49.75 | 49.63 | | | |
| | short | 3/10/08 | 4/20/09 | 406 | 62.50 | 56.50 | 69.14 | 6.64 | 10.62 | | | |
| | long | 4/20/09 | 8/10/09 | 112 | 56.50 | 79.00 | | 22.50 | 39.82 | | | 136.67 |
| Zhejiang Huayou | short | 3/13/23 | 4/17/23 | 35 | 56.55 | 56.10 | 57.00 | 0.45 | 0.80 | | | |
| | short | 5/08/23 | 4/08/24 | 336 | 52.67 | 30.95 | 89.63 | 36.96 | 70.18 | | | |
| | short | 6/10/24 | 8/12/24 | 63 | 26.43 | 22.26 | 31.38 | 4.95 | 18.73 | | | 103.68 |
| Kinross Gold | short | 2/01/10 | 2/08/10 | 7 | 18.47 | 19.30 | 17.64 | -0.83 | -4.49 | | | |
| | short | 2/22/10 | 10/18/10 | 238 | 19.07 | 18.28 | 19.89 | 0.82 | 4.32 | | | |
| | short | 4/11/11 | 12/17/12 | 616 | 15.04 | 9.57 | 23.64 | 8.60 | 57.16 | | | |
| | long | 6/13/16 | 6/27/16 | 14 | 6.60 | 6.74 | | 0.14 | 2.12 | | | 59.90 |
| Teck Resources | long | 8/24/09 | 2/01/10 | 161 | 27.55 | 36.86 | | 9.31 | 33.79 | | | |
| | long | 2/08/10 | 2/22/10 | 14 | 37.87 | 39.72 | | 1.85 | 4.89 | | | |
| | long | 10/24/16 | 11/14/16 | 21 | 27.46 | 31.01 | | 3.55 | 12.93 | | | 58.47 |
| Wheaton Precious | long | 10/18/10 | 4/11/11 | 175 | 26.97 | 40.90 | | 13.93 | 51.65 | | | 51.65 |
| Mitsui Ming & Smltg | short | 7/17/06 | 8/07/06 | 21 | 64.80 | 60.90 | 68.95 | 4.15 | 6.40 | | | |
| | short | 8/28/06 | 9/04/06 | 7 | 67.90 | 69.30 | 66.50 | -1.40 | -2.06 | | | |
| | short | 9/11/06 | 12/04/06 | 84 | 64.60 | 55.40 | 75.33 | 10.73 | 16.61 | | | |
| | short | 1/08/07 | 2/05/07 | 28 | 57.20 | 63.00 | 51.40 | -5.80 | -10.14 | | | |
| | short | 4/30/07 | 10/22/07 | 175 | 59.60 | 49.60 | 71.62 | 12.02 | 20.16 | | | 31.21 |
| Barrick Gold | short | 8/10/09 | 8/24/09 | 14 | 37.40 | 38.73 | 36.07 | -1.33 | -3.56 | | | |
| | short | 2/04/13 | 6/13/16 | 1225 | 32.58 | 25.90 | 40.98 | 8.40 | 25.79 | | | 21.32 |
| Eldorado Gold | short | 2/05/18 | 6/24/19 | 504 | 7.60 | 7.22 | 8.00 | 0.40 | 5.26 | | | |
| | long | 4/17/23 | 5/08/23 | 21 | 14.98 | 15.96 | | 0.98 | 6.54 | | | 12.15 |
| instrument | L/S | date buy | date sell | days | prc buy | prc sell | ps short | prc diff | d % | | | total |
| Vedanta | long | 2/05/07 | 2/26/07 | 21 | 18.48 | 19.96 | | 1.48 | 8.03 | | | 8.03 |
| Coal India | long | 4/08/24 | 6/10/24 | 63 | 44.74 | 47.77 | | 3.03 | 6.77 | | | 6.77 |
| Goldcorp | short | 2/26/07 | 3/12/07 | 14 | 29.37 | 27.69 | 31.15 | 1.78 | 6.07 | | | 6.07 |
| Shandong Gold | short | 12/14/20 | 1/04/21 | 21 | 23.53 | 24.17 | 22.89 | -0.64 | -2.72 | | | |
| | short | 1/11/21 | 5/24/21 | 133 | 23.39 | 21.12 | 25.90 | 2.51 | 10.75 | | | |
| | short | 6/07/21 | 3/07/22 | 273 | 20.40 | 21.13 | 19.67 | -0.73 | -3.58 | | | 3.88 |
| Fortescue Metals | long | 6/24/19 | 7/08/19 | 14 | 8.82 | 8.85 | | 0.03 | 0.34 | | | 0.34 |
| Norilsk Nickel | short | 3/14/22 | 3/21/22 | 7 | 9.44 | 9.44 | 9.44 | 0.00 | 0.00 | | | |
| | short | 4/25/22 | 1/09/23 | 259 | 9.44 | 9.44 | 9.44 | 0.00 | 0.00 | | | 0.00 |
| Newcrest Mining | short | 12/31/12 | 1/14/13 | 14 | 22.84 | 23.00 | 22.68 | -0.16 | -0.70 | | | -0.70 |
| First Quantum | short | 7/08/19 | 9/07/20 | 427 | 11.55 | 12.93 | 10.17 | -1.38 | -11.95 | | | |
| | long | 12/07/20 | 12/14/20 | 7 | 19.67 | 20.42 | | 0.75 | 3.81 | | | |
| | long | 1/04/21 | 1/11/21 | 7 | 24.81 | 24.68 | | -0.13 | -0.52 | | | |
| | long | 5/24/21 | 6/07/21 | 14 | 27.34 | 29.07 | | 1.73 | 6.33 | | | -3.32 |
| Glencore | long | 4/10/17 | 5/01/17 | 21 | 3.19 | 3.05 | | -0.14 | -4.40 | | | -4.40 |
| China Shenhua HK | long | 10/22/07 | 11/05/07 | 14 | 46.36 | 43.98 | | -2.38 | -5.13 | | | -5.13 |
| Agnico-Eagle Mines | long | 12/17/12 | 12/31/12 | 14 | 52.21 | 50.39 | | -1.82 | -3.49 | | | |
| | long | 1/14/13 | 2/04/13 | 21 | 50.12 | 45.32 | | -4.80 | -9.58 | | | -12.73 |
| Yamana Gold | long | 3/12/07 | 4/30/07 | 49 | 16.33 | 15.62 | | -0.71 | -4.35 | | | |
| | short | 5/01/17 | 1/08/18 | 252 | 3.57 | 3.94 | 3.20 | -0.37 | -10.36 | | | -14.26 |
| Sumitomo Metal | short | 6/27/16 | 7/04/16 | 7 | 20.07 | 21.80 | 18.34 | -1.73 | -8.62 | | | |
| | long | 1/08/18 | 2/05/18 | 28 | 54.90 | 49.93 | | -4.97 | -9.05 | | | -16.89 |
| Fresnillo | long | 7/04/16 | 10/10/16 | 98 | 19.08 | 16.85 | | -2.23 | -11.67 | | | |
| | long | 9/07/20 | 10/26/20 | 49 | 13.19 | 12.18 | | -1.01 | -7.66 | | | -18.44 |
| Peñoles | long | 1/09/23 | 3/13/23 | 63 | 291.30 | 236.59 | | -54.71 | -18.78 | | | -18.78 |
| instrument | L/S | date buy | date sell | days | prc buy | prc sell | ps short | prc diff | d % | | | total |
| Cameco | short | 10/10/16 | 10/24/16 | 14 | 10.47 | 10.39 | 10.55 | 0.08 | 0.77 | | | |
| | short | 11/14/16 | 4/10/17 | 147 | 10.33 | 15.47 | 5.19 | -5.14 | -49.76 | | | -49.37 |
| Eramet | long | 2/18/08 | 3/10/08 | 21 | 419.75 | 475.22 | | 55.47 | 13.22 | | | |
| | short | 10/26/20 | 12/07/20 | 42 | 23.78 | 40.00 | 7.56 | -16.22 | -68.21 | | | |
| | long | 3/07/22 | 3/14/22 | 7 | 127.60 | 124.90 | | -2.70 | -2.12 | | | |
| | long | 3/21/22 | 4/25/22 | 35 | 142.80 | 131.30 | | -11.50 | -8.05 | | | -67.61 |
Annotations
| 1/01/19 | Eldorado Gold | | | reverse stock split 5:1 (five become one) |
| 5/22/17 | Silver Wheaton | | | is now called Wheaton Precious Metals |
| 3/09/17 | Fortescue Metals | | | returns to the ASX 50 |
| 4/05/16 | Bergbau | | | re-analysis of exchanging techniques after component exchanges |
| 9/02/15 | Mining | | | complete analysis |
| 5/11/15 | Franco-Nevada | | | registered |
|
|