| | |
| | |

Auswertung - Automobilzulieferer - 1.07.24 - RS = 49
⇐
| |
|
⇓Wertpapier |
jüngster |
⇓ ΔTag |
1.07.24 |
⇓ ΔWo |
24.07.23 |
K-Diff |
Δ49 |
Whrg |
⇓∅-RS |
| |  |
 |
 |
|
S |
 |
SOM Auto Suppliers |
246,607 |
12.08.24 |
0,08 |
268,913 |
-8,29 |
299,418 |
-30,505 |
-10,19 |
USD |
-3,14 |
| | |
|
|
|
|
|
Michelin |
34,340 |
12.08.24 |
0,41 |
36,100 |
-4,88 |
28,660 |
7,440 |
25,96 |
EUR |
18,67 |
| | |
|
|
|
|
|
Pirelli |
5,246 |
12.08.24 |
0,50 |
5,616 |
-6,59 |
4,700 |
0,916 |
19,49 |
EUR |
19,13 |
| | |
|
|
|
|
|
Hella |
86,300 |
12.08.24 |
0,23 |
85,900 |
0,47 |
73,000 |
12,900 |
17,67 |
EUR |
10,07 |
| | |
|
|
|
|
|
Yokohama Rubber |
3.085,000 |
9.08.24 |
2,88 |
3.589,000 |
-14,04 |
3.104,000 |
485,000 |
15,63 |
JPY |
5,54 |
| | |
|
|
|
L |
|
GS Yuasa |
2.358,000 |
9.08.24 |
2,70 |
3.153,000 |
-25,21 |
2.829,500 |
323,500 |
11,43 |
JPY |
24,21 |
| | |
|
|
|
|
|
Bridgestone |
5.582,000 |
9.08.24 |
-1,33 |
6.295,000 |
-11,33 |
5.792,000 |
503,000 |
8,68 |
JPY |
5,28 |
| | |
|
|
|
|
|
Autoliv |
1.003,400 |
12.08.24 |
0,10 |
1.139,800 |
-11,97 |
1.063,000 |
76,800 |
7,22 |
SEK |
5,89 |
| | |
|
|
|
S |
|
Denso |
2.109,000 |
9.08.24 |
-0,19 |
2.527,000 |
-16,54 |
2.410,750 |
116,250 |
4,82 |
JPY |
-4,88 |
| | |
|
|
|
|
|
Hyundai Mobis |
218.500,000 |
12.08.24 |
2,82 |
247.500,000 |
-11,72 |
240.000,000 |
7.500,000 |
3,13 |
KRW |
1,84 |
| | |
|
|
|
S |
|
Nokian Tyres |
7,982 |
12.08.24 |
-0,84 |
7,850 |
1,68 |
8,270 |
-0,420 |
-5,08 |
EUR |
-4,64 |
| | |
|
|
|
S |
|
Schaeffler |
4,646 |
12.08.24 |
0,17 |
5,345 |
-13,08 |
5,900 |
-0,555 |
-9,41 |
EUR |
-2,90 |
| | |
|
|
|
S |
|
Vitesco Technologies |
52,050 |
12.08.24 |
-0,10 |
59,850 |
-13,03 |
77,150 |
-17,300 |
-22,42 |
EUR |
-19,51 |
| | |
|
|
|
|
|
Xinyi Glass |
7,550 |
12.08.24 |
-0,13 |
8,560 |
-11,80 |
11,240 |
-2,680 |
-23,84 |
HKD |
-5,84 |
| | |
|
|
|
L |
|
Cdn Tire |
149,260 |
12.08.24 |
-0,17 |
135,740 |
9,96 |
185,820 |
-50,080 |
-26,95 |
CAD |
-6,95 |
| | |
|
|
|
S |
|
Continental |
58,860 |
12.08.24 |
0,34 |
53,040 |
10,97 |
73,500 |
-20,460 |
-27,84 |
EUR |
-17,95 |
| | |
|
|
|
S |
|
Magna |
52,280 |
12.08.24 |
-1,88 |
57,340 |
-8,82 |
82,200 |
-24,860 |
-30,24 |
CAD |
-19,18 |
| | |
|
|
|
S |
|
LG Energy Solution |
328.500,000 |
12.08.24 |
2,02 |
347.000,000 |
-5,33 |
597.000,000 |
-250.000,000 |
-41,88 |
KRW |
-22,61 |
| | |
|
|
|
|
|
Opmobility |
8,540 |
12.08.24 |
-1,16 |
9,300 |
-8,17 |
19,120 |
-9,820 |
-51,36 |
EUR |
-22,39 |
| | |
|
|
|
|
|
Valeo |
9,400 |
12.08.24 |
-0,95 |
10,045 |
-6,42 |
21,480 |
-11,435 |
-53,24 |
EUR |
-28,87 |
| | |
|
|
|
|
|
Forvia |
9,166 |
12.08.24 |
0,17 |
11,500 |
-20,30 |
24,870 |
-13,370 |
-53,76 |
EUR |
-29,56 |
| Autozulieferer - 20 von 20 Wertpapieren bewertet - 1.07.24 / 24.07.23 - 9 davon sind besser, Markt-Kennzahl(49) = 45,00 % |
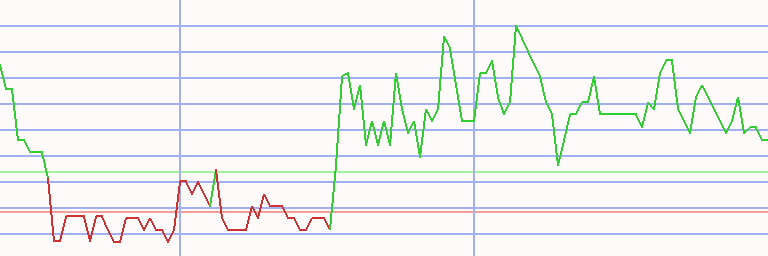
Technischer Chart
Transaktionen Automobilzulieferer * A49 - 33/17 (1)
|
⇐ |
| |
| L/S | K-Datum | V-Datum | Tage | | Wertpapier | Spl | Stück | Whrg | K-Kurs | V-Kurs | S-V-Kurs | K-Diff | D % | Kapital | Rdte | |
| 2.01.06 |
3.03.08 |
791 |
|
- cash - |
| short |
3.03.08 |
7.09.09 |
553 |
|
|
|
Forvia |
100 |
289 |
EUR |
34,500 |
9,820 |
121,207 |
86,707 |
251 |
35.058 |
129 |
|
| long |
7.09.09 |
14.11.11 |
798 |
|
|
|
Opmobility |
100 |
21.468 |
EUR |
1,633 |
6,219 |
|
4,586 |
281 |
133.510 |
84 |
|
| short |
14.11.11 |
30.01.12 |
77 |
|
|
|
Forvia |
100 |
7.646 |
EUR |
17,460 |
18,475 |
16,445 |
-1,015 |
-6 |
125.750 |
-25 |
|
| long |
30.01.12 |
4.06.12 |
126 |
|
|
|
Bertrandt |
100 |
2.287 |
EUR |
54,980 |
52,020 |
|
-2,960 |
-5 |
118.980 |
-15 |
|
| short |
4.06.12 |
16.07.12 |
42 |
|
|
|
Forvia |
100 |
9.412 |
EUR |
12,640 |
12,290 |
13,000 |
0,360 |
3 |
122.369 |
28 |
|
| long |
16.07.12 |
8.02.16 |
1302 |
|
|
|
Continental |
100 |
2.055 |
EUR |
59,533 |
149,667 |
|
90,134 |
151 |
307.593 |
29 |
|
| short |
8.02.16 |
7.03.16 |
28 |
|
|
|
Leoni |
100 |
10.601 |
EUR |
29,015 |
30,500 |
27,530 |
-1,485 |
-5 |
291.851 |
-50 |
|
| long |
7.03.16 |
8.10.18 |
945 |
|
|
|
Grammer |
100 |
8.704 |
EUR |
33,530 |
45,600 |
|
12,070 |
36 |
396.908 |
13 |
|
| short |
8.10.18 |
23.09.19 |
350 |
|
|
|
Valeo |
100 |
12.384 |
EUR |
32,050 |
28,840 |
35,617 |
3,567 |
11 |
441.086 |
12 |
|
| long |
23.09.19 |
7.10.19 |
14 |
|
|
|
Hyundai Mobis |
100 |
1.753 |
KRW |
251,500 |
244,000 |
|
-7,500 |
-3 |
427.938 |
-55 |
|
| short |
7.10.19 |
21.10.19 |
14 |
|
|
|
STS |
100 |
94.676 |
EUR |
4,520 |
4,450 |
4,591 |
0,071 |
2 |
434.670 |
50 |
|
| long |
21.10.19 |
24.02.20 |
126 |
|
|
|
Valeo |
100 |
13.345 |
EUR |
32,570 |
25,260 |
|
-7,310 |
-22 |
337.118 |
-52 |
|
| short |
24.02.20 |
7.12.20 |
287 |
|
|
|
STS |
100 |
71.423 |
EUR |
4,720 |
4,790 |
4,650 |
-0,070 |
-1 |
332.118 |
-2 |
|
| long |
7.12.20 |
7.03.22 |
455 |
|
|
|
Opmobility |
100 |
11.572 |
EUR |
28,700 |
15,550 |
|
-13,150 |
-46 |
179.946 |
-39 |
|
| short |
7.03.22 |
12.09.22 |
189 |
|
|
|
Nokian Tyres |
100 |
12.830 |
EUR |
14,025 |
11,530 |
17,060 |
3,035 |
22 |
218.884 |
46 |
|
| long |
12.09.22 |
19.09.22 |
7 |
|
|
|
Yokohama Rubber |
100 |
9.208 |
JPY |
23,770 |
23,160 |
|
-0,610 |
-3 |
213.267 |
-74 |
|
| short |
19.09.22 |
6.02.23 |
140 |
|
|
|
Forvia |
100 |
14.308 |
EUR |
14,905 |
18,825 |
10,985 |
-3,920 |
-26 |
157.180 |
-55 |
|
| long |
6.02.23 |
12.08.24 |
553 |
|
|
|
Autoliv |
100 |
165 |
SEK |
947,200 |
1.003,400 |
|
56,200 |
6 |
166.453 |
4 |
|
| kum | 3.03.08 |
12.08.24 | 6662 |
Tage von 7453 investiert (89%) |
1.565 |
166.453 |
17 |
|
Anteil der Einzelwerte
| Wertpapier | L/S | K-Datum | V-Datum | Tage | K-Kurs | V-Kurs | S-V-Kurs | K-Diff | D % | | | Summe |
| Continental | long | 16.07.12 | 8.02.16 | 1302 | 59,53 | 149,67 | | 90,13 | 151,40 | | | 151,40 |
| Forvia | short | 3.03.08 | 7.09.09 | 553 | 34,50 | 9,82 | 121,21 | 86,71 | 251,32 | | | |
| | short | 14.11.11 | 30.01.12 | 77 | 17,46 | 18,48 | 16,45 | -1,02 | -5,81 | | | |
| | short | 4.06.12 | 16.07.12 | 42 | 12,64 | 12,29 | 13,00 | 0,36 | 2,85 | | | |
| | short | 19.09.22 | 6.02.23 | 140 | 14,91 | 18,83 | 10,99 | -3,92 | -26,30 | | | 150,82 |
| Opmobility | long | 7.09.09 | 14.11.11 | 798 | 1,63 | 6,22 | | 4,59 | 280,83 | | | |
| | long | 7.12.20 | 7.03.22 | 455 | 28,70 | 15,55 | | -13,15 | -45,82 | | | 106,34 |
| Grammer | long | 7.03.16 | 8.10.18 | 945 | 33,53 | 45,60 | | 12,07 | 36,00 | | | 36,00 |
| Nokian Tyres | short | 7.03.22 | 12.09.22 | 189 | 14,03 | 11,53 | 17,06 | 3,03 | 21,64 | | | 21,64 |
| Autoliv | long | 6.02.23 | 12.08.24 | 553 | 947,20 | 1.003,40 | | 56,20 | 5,93 | | | 5,93 |
| STS | short | 7.10.19 | 21.10.19 | 14 | 4,52 | 4,45 | 4,59 | 0,07 | 1,57 | | | |
| | short | 24.02.20 | 7.12.20 | 287 | 4,72 | 4,79 | 4,65 | -0,07 | -1,48 | | | 0,07 |
| Yokohama Rubber | long | 12.09.22 | 19.09.22 | 7 | 23,77 | 23,16 | | -0,61 | -2,57 | | | -2,57 |
| Hyundai Mobis | long | 23.09.19 | 7.10.19 | 14 | 251,50 | 244,00 | | -7,50 | -2,98 | | | -2,98 |
| Leoni | short | 8.02.16 | 7.03.16 | 28 | 29,02 | 30,50 | 27,53 | -1,49 | -5,12 | | | -5,12 |
| Bertrandt | long | 30.01.12 | 4.06.12 | 126 | 54,98 | 52,02 | | -2,96 | -5,38 | | | -5,38 |
| Valeo | short | 8.10.18 | 23.09.19 | 350 | 32,05 | 28,84 | 35,62 | 3,57 | 11,13 | | | |
| | long | 21.10.19 | 24.02.20 | 126 | 32,57 | 25,26 | | -7,31 | -22,44 | | | -13,81 |
Anmerkungen
| 28.09.23 | Denso | | | Aktiensplit 1:4 (vier für eine) |
| 16.06.22 | Michelin | | | Aktiensplit 1:4 (vier für eine) |
| 4.04.22 | Hella | | | übernommen von Faurecia |
| 16.09.21 | Continental | | | Abspaltung Antriebs-Technologie: eine zusätzliche Vitesco für fünf Continental |
| 29.06.18 | Autoliv | | | Abspaltung Veoneer |
| 22.06.18 | Pirelli | | | kommt dafür zurück |
| 10.02.17 | Autozulieferer | | | Maschinelles Lernen für alle Verfahren durchgeführt |
| 6.06.16 | Valeo | | | Aktien-Split 1:3 (drei für eine) |
| 4.06.16 | Schaeffler | | | wechselt vom SDAX in den MDAX (2016-06-20) |
| 21.12.15 | Schaeffler | | | Neuaufnahme (SDAX) |
| 2.11.15 | Pirelli | | | scheidet wegen Übernahme durch CNCC aus |
| 21.09.15 | Hella | | | wechselt vom SDAX in den MDAX |
| 26.03.15 | Magna | | | Aktien-Split 1:2 (zwei für eine) |
| 13.03.15 | Auto-Zulieferer | | | erste vollständige Analyse, Best Long und Short arbeiten nicht gut zusammen,
das alternative Verfahren sieht sehr gut aus. |
|
|