| | |
| | |

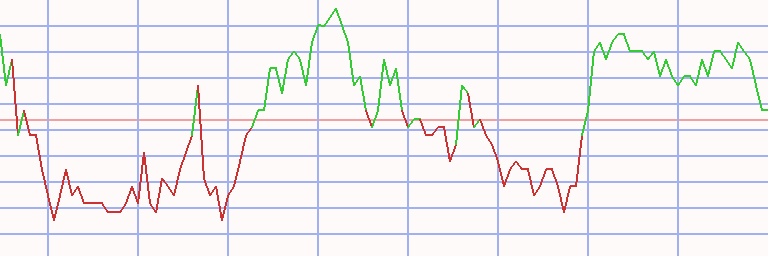
Assessment - OMX Stockholm 30 - 7/01/24 - RS = 15
⇐
| |
|
⇓instrument |
freshest |
⇓ Δday |
7/01/24 |
⇓ Δwk |
3/18/24 |
prc diff |
Δ15 |
|
⇓∅-RS |
| |  |
 |
 |
|
|
 |
OMXS30 |
2,460.900 |
8/12/24 |
0.09 |
2,584.830 |
-4.79 |
2,504.800 |
80.030 |
3.20 |
|
10.06 |
| | |
|
|
|
L |
|
SBB |
6.220 |
8/12/24 |
-2.81 |
5.820 |
6.87 |
3.542 |
2.278 |
64.31 |
|
44.51 |
| | |
|
|
|
L |
|
Tele2 |
109.850 |
8/12/24 |
0.69 |
106.600 |
3.05 |
86.620 |
19.980 |
23.07 |
|
20.61 |
| | |
|
|
|
L |
|
AstraZeneca |
1,724.000 |
8/12/24 |
0.88 |
1,659.500 |
3.89 |
1,380.500 |
279.000 |
20.21 |
|
14.55 |
| | |
|
|
|
|
|
Boliden |
305.000 |
8/12/24 |
1.33 |
340.000 |
-10.29 |
284.450 |
55.550 |
19.53 |
|
10.74 |
| | |
|
|
|
L |
|
Ericsson |
71.080 |
8/12/24 |
1.14 |
67.100 |
5.93 |
56.140 |
10.960 |
19.52 |
|
9.98 |
| | |
|
|
|
L |
|
ABB |
553.000 |
8/12/24 |
0.47 |
592.600 |
-6.68 |
498.800 |
93.800 |
18.81 |
|
33.70 |
| | |
|
|
|
L |
|
Hennes & Mauritz |
157.800 |
8/12/24 |
-0.22 |
167.450 |
-5.76 |
145.760 |
21.690 |
14.88 |
|
15.23 |
| | |
|
|
|
L |
|
Alfa Laval |
447.500 |
8/12/24 |
0.61 |
469.900 |
-4.77 |
419.500 |
50.400 |
12.01 |
|
18.30 |
| | |
|
|
|
L |
|
Telia Company |
30.910 |
8/12/24 |
0.19 |
28.870 |
7.07 |
25.870 |
3.000 |
11.60 |
|
8.16 |
| | |
|
|
|
L |
|
Essity B |
297.100 |
8/12/24 |
-0.97 |
275.900 |
7.68 |
247.800 |
28.100 |
11.34 |
|
6.28 |
| | |
|
|
|
L |
|
Investor |
286.000 |
8/12/24 |
0.30 |
290.050 |
-1.40 |
263.150 |
26.900 |
10.22 |
|
22.11 |
| | |
|
|
|
S |
|
Sinch |
25.950 |
8/12/24 |
-2.15 |
26.640 |
-2.59 |
24.260 |
2.380 |
9.81 |
|
-6.91 |
| | |
|
|
|
L |
|
Atlas Copco A |
177.150 |
8/12/24 |
0.28 |
198.800 |
-10.89 |
182.000 |
16.800 |
9.23 |
|
22.21 |
| | |
|
|
|
L |
|
Atlas Copco B |
155.450 |
8/12/24 |
|
170.950 |
-9.07 |
159.750 |
11.200 |
7.01 |
|
21.45 |
| | |
|
|
|
|
|
Nordea Bank |
119.800 |
8/12/24 |
-0.13 |
130.150 |
-7.95 |
124.220 |
5.930 |
4.77 |
|
4.68 |
| | |
|
|
|
|
|
S.E.B |
150.700 |
8/12/24 |
-0.10 |
157.800 |
-4.50 |
153.650 |
4.150 |
2.70 |
|
11.92 |
| | |
|
|
|
|
|
Svenska Cellulosa B |
137.050 |
8/12/24 |
0.81 |
156.050 |
-12.18 |
151.950 |
4.100 |
2.70 |
|
3.90 |
| | |
|
|
|
|
|
Assa Abloy |
305.900 |
8/12/24 |
0.13 |
300.300 |
1.86 |
300.700 |
-0.400 |
-0.13 |
|
11.51 |
| | |
|
|
|
|
|
Swedbank |
207.100 |
8/12/24 |
-0.86 |
222.600 |
-6.96 |
225.000 |
-2.400 |
-1.07 |
|
4.69 |
| | |
|
|
|
L |
|
Electrolux |
85.820 |
8/12/24 |
-0.26 |
87.520 |
-1.94 |
90.340 |
-2.820 |
-3.12 |
|
-11.33 |
| | |
|
|
|
|
|
Hexagon |
100.700 |
8/12/24 |
-0.15 |
120.400 |
-16.36 |
124.450 |
-4.050 |
-3.25 |
|
4.61 |
| | |
|
|
|
|
|
SKF B |
186.400 |
8/12/24 |
|
214.100 |
-12.94 |
232.000 |
-17.900 |
-7.72 |
|
4.94 |
| | |
|
|
|
|
|
Autoliv |
1,003.400 |
8/12/24 |
0.10 |
1,139.800 |
-11.97 |
1,246.000 |
-106.200 |
-8.52 |
|
5.89 |
| | |
|
|
|
|
|
Sandvik |
202.600 |
8/12/24 |
-0.54 |
215.000 |
-5.77 |
240.400 |
-25.400 |
-10.57 |
|
0.70 |
| |
|
⇓instrument |
freshest |
⇓ Δday |
7/01/24 |
⇓ Δwk |
3/18/24 |
prc diff |
Δ15 |
|
⇓∅-RS |
| | |
|
|
|
|
|
Volvo |
255.700 |
8/12/24 |
-0.12 |
273.400 |
-6.47 |
305.750 |
-32.350 |
-10.58 |
|
6.58 |
| | |
|
|
|
S |
|
Getinge |
198.050 |
8/12/24 |
-0.10 |
181.450 |
9.15 |
208.700 |
-27.250 |
-13.06 |
|
-12.69 |
| | |
|
|
|
S |
|
Svenska Handelsbank |
102.150 |
8/12/24 |
0.29 |
101.800 |
0.34 |
120.350 |
-18.550 |
-15.41 |
|
-1.38 |
| | |
|
|
|
|
|
Kinnevik |
79.430 |
8/12/24 |
-0.36 |
88.800 |
-10.55 |
107.200 |
-18.400 |
-17.16 |
|
-16.93 |
| | |
|
|
|
|
|
NIBE Industrier |
44.580 |
8/12/24 |
0.18 |
45.150 |
-1.26 |
55.000 |
-9.850 |
-17.91 |
|
-27.82 |
| | |
|
|
|
S |
|
Evolution |
997.600 |
8/12/24 |
-0.88 |
1,105.500 |
-9.76 |
1,365.600 |
-260.100 |
-19.05 |
|
-11.48 |
| OMXS 30 - 30 out of 30 instruments rated - 7/01/24 / 3/18/24 - 17 did rise, Market-Ratio(15) = 56.67 % |
| Stock Exchange Currency: SEK kr Swedish krona |
Technical Chart
Transactions OMX Stockholm 30 * S15 - 53 ex 3 (1)
|
⇐ |
| |
| L/S | date buy | date sell | days | | instrument | spl | pieces | | prc buy | prc sell | ps short | prc diff | d % | asset | yield | |
| 1/02/06 |
6/05/06 |
154 |
|
- cash - |
| short |
6/05/06 |
8/28/06 |
84 |
|
|
|
Ericsson |
100 |
90 |
|
110.000 |
120.000 |
100.000 |
-10.000 |
-9 |
9,100 |
-34 |
|
| 8/28/06 |
6/04/07 |
280 |
|
- cash - |
| |
6/04/07 |
6/11/07 |
7 |
|
|
|
Essity B |
100 |
95 |
|
95.720 |
93.140 |
98.372 |
2.652 |
3 |
9,352 |
316 |
|
| 6/11/07 |
7/02/07 |
21 |
|
- cash - |
| |
7/02/07 |
7/09/07 |
7 |
|
|
|
Svenska Cellulosa B |
100 |
402 |
|
23.250 |
23.810 |
22.690 |
-0.560 |
-2 |
9,127 |
-72 |
|
| 7/09/07 |
7/23/07 |
14 |
|
- cash - |
| |
7/23/07 |
11/19/07 |
119 |
|
|
|
Svenska Cellulosa B |
100 |
382 |
|
23.860 |
22.280 |
25.552 |
1.692 |
7 |
9,773 |
23 |
|
| |
11/19/07 |
12/24/07 |
35 |
|
|
|
NIBE Industrier |
100 |
2,767 |
|
3.531 |
4.664 |
2.399 |
-1.133 |
-32 |
6,639 |
-98 |
|
| |
12/24/07 |
4/28/08 |
126 |
|
|
|
Boliden |
100 |
81 |
|
81.250 |
65.750 |
100.404 |
19.154 |
24 |
8,191 |
85 |
|
| 4/28/08 |
6/02/08 |
35 |
|
- cash - |
| |
6/02/08 |
6/23/08 |
21 |
|
|
|
NIBE Industrier |
100 |
2,911 |
|
2.813 |
2.789 |
2.837 |
0.024 |
1 |
8,261 |
16 |
|
| |
6/23/08 |
1/05/09 |
196 |
|
|
|
Boliden |
100 |
169 |
|
48.600 |
20.600 |
114.658 |
66.058 |
136 |
19,425 |
395 |
|
| |
1/05/09 |
2/02/09 |
28 |
|
|
|
Swedbank |
100 |
443 |
|
43.800 |
30.200 |
63.525 |
19.725 |
45 |
28,163 |
12,630 |
|
| 2/02/09 |
2/16/09 |
14 |
|
- cash - |
| |
2/16/09 |
3/02/09 |
14 |
|
|
|
Swedbank |
100 |
1,050 |
|
26.800 |
18.400 |
39.035 |
12.235 |
46 |
41,009 |
> 999,999 |
|
| 3/02/09 |
3/23/09 |
21 |
|
- cash - |
| |
3/23/09 |
3/30/09 |
7 |
|
|
|
S.E.B |
100 |
1,518 |
|
27.000 |
32.400 |
21.600 |
-5.400 |
-20 |
32,812 |
-100 |
|
| 3/30/09 |
2/01/10 |
308 |
|
- cash - |
| |
2/01/10 |
2/15/10 |
14 |
|
|
|
Ericsson |
100 |
456 |
|
71.950 |
72.800 |
71.100 |
-0.850 |
-1 |
32,424 |
-27 |
|
| 2/15/10 |
2/22/10 |
7 |
|
- cash - |
| |
2/22/10 |
3/01/10 |
7 |
|
|
|
AstraZeneca |
100 |
103 |
|
313.600 |
323.100 |
304.100 |
-9.500 |
-3 |
31,446 |
-80 |
|
| 3/01/10 |
5/03/10 |
63 |
|
- cash - |
| |
5/03/10 |
5/10/10 |
7 |
|
|
|
Nordea Bank |
100 |
521 |
|
60.300 |
66.950 |
53.650 |
-6.650 |
-11 |
27,981 |
-100 |
|
| 5/10/10 |
6/21/10 |
42 |
|
- cash - |
| |
6/21/10 |
7/19/10 |
28 |
|
|
|
NIBE Industrier |
100 |
6,903 |
|
4.053 |
3.844 |
4.273 |
0.220 |
5 |
29,500 |
99 |
|
| 7/19/10 |
7/26/10 |
7 |
|
- cash - |
| |
7/26/10 |
8/02/10 |
7 |
|
|
|
NIBE Industrier |
100 |
7,225 |
|
4.083 |
4.053 |
4.113 |
0.030 |
1 |
29,717 |
46 |
|
| 8/02/10 |
8/09/10 |
7 |
|
- cash - |
| |
8/09/10 |
8/16/10 |
7 |
|
|
|
Electrolux |
100 |
194 |
|
152.400 |
151.200 |
153.610 |
1.209 |
1 |
29,951 |
51 |
|
| 8/16/10 |
3/14/11 |
210 |
|
- cash - |
| |
3/14/11 |
3/28/11 |
14 |
|
|
|
AstraZeneca |
100 |
103 |
|
289.000 |
294.200 |
283.800 |
-5.200 |
-2 |
29,416 |
-38 |
|
| 3/28/11 |
4/04/11 |
7 |
|
- cash - |
| |
4/04/11 |
5/02/11 |
28 |
|
|
|
AstraZeneca |
100 |
97 |
|
301.500 |
315.800 |
287.200 |
-14.300 |
-5 |
28,029 |
-47 |
|
| |
5/02/11 |
5/09/11 |
7 |
|
|
|
Svenska Cellulosa B |
100 |
1,459 |
|
19.210 |
19.590 |
18.830 |
-0.380 |
-2 |
27,474 |
-65 |
|
| 5/09/11 |
5/16/11 |
7 |
|
- cash - |
| |
5/16/11 |
5/30/11 |
14 |
|
|
|
Tele2 |
100 |
220 |
|
124.500 |
123.000 |
126.018 |
1.518 |
1 |
27,808 |
37 |
|
| 5/30/11 |
6/06/11 |
7 |
|
- cash - |
| |
6/06/11 |
6/20/11 |
14 |
|
|
|
Tele2 |
100 |
235 |
|
118.200 |
119.500 |
116.900 |
-1.300 |
-1 |
27,503 |
-25 |
|
| |
6/20/11 |
6/27/11 |
7 |
|
|
|
Telia Company |
100 |
616 |
|
44.580 |
46.360 |
42.800 |
-1.780 |
-4 |
26,406 |
-88 |
|
| 6/27/11 |
7/11/11 |
14 |
|
- cash - |
| |
7/11/11 |
7/18/11 |
7 |
|
|
|
Telia Company |
100 |
588 |
|
44.880 |
48.060 |
41.700 |
-3.180 |
-7 |
24,536 |
-98 |
|
| |
7/18/11 |
10/24/11 |
98 |
|
|
|
Electrolux |
100 |
200 |
|
122.500 |
126.500 |
118.500 |
-4.000 |
-3 |
23,736 |
-12 |
|
| L/S | date buy | date sell | days | | instrument | spl | pieces | | prc buy | prc sell | ps short | prc diff | d % | asset | yield | | | |
10/24/11 |
11/14/11 |
21 |
|
|
|
Hexagon |
100 |
1,803 |
|
13.164 |
14.057 |
12.272 |
-0.893 |
-7 |
22,127 |
-70 |
|
| |
11/14/11 |
11/21/11 |
7 |
|
|
|
Electrolux |
100 |
207 |
|
106.600 |
106.400 |
106.800 |
0.200 |
0 |
22,168 |
10 |
|
| |
11/21/11 |
11/28/11 |
7 |
|
|
|
Hexagon |
100 |
1,775 |
|
12.486 |
13.414 |
11.557 |
-0.929 |
-7 |
20,520 |
-98 |
|
| 11/28/11 |
5/07/12 |
161 |
|
- cash - |
| |
5/07/12 |
5/28/12 |
21 |
|
|
|
Ericsson |
100 |
327 |
|
62.650 |
64.700 |
60.600 |
-2.050 |
-3 |
19,850 |
-44 |
|
| |
5/28/12 |
7/23/12 |
56 |
|
|
|
Tele2 |
100 |
181 |
|
109.100 |
112.400 |
105.800 |
-3.300 |
-3 |
19,252 |
-18 |
|
| 7/23/12 |
6/10/13 |
322 |
|
- cash - |
| |
6/10/13 |
7/08/13 |
28 |
|
|
|
Tele2 |
100 |
238 |
|
80.600 |
80.550 |
80.650 |
0.050 |
0 |
19,264 |
1 |
|
| 7/08/13 |
9/02/13 |
56 |
|
- cash - |
| |
9/02/13 |
9/09/13 |
7 |
|
|
|
Tele2 |
100 |
227 |
|
84.650 |
83.650 |
85.662 |
1.012 |
1 |
19,494 |
86 |
|
| 9/09/13 |
3/03/14 |
175 |
|
- cash - |
| |
3/03/14 |
3/10/14 |
7 |
|
|
|
Electrolux |
100 |
131 |
|
148.800 |
146.900 |
150.725 |
1.925 |
1 |
19,746 |
95 |
|
| 3/10/14 |
8/18/14 |
161 |
|
- cash - |
| |
8/18/14 |
8/25/14 |
7 |
|
|
|
Getinge |
100 |
115 |
|
171.300 |
182.100 |
160.500 |
-10.800 |
-6 |
18,504 |
-97 |
|
| 8/25/14 |
9/15/14 |
21 |
|
- cash - |
| |
9/15/14 |
9/29/14 |
14 |
|
|
|
Volvo |
100 |
228 |
|
80.950 |
78.100 |
83.904 |
2.954 |
4 |
19,177 |
155 |
|
| 9/29/14 |
10/06/14 |
7 |
|
- cash - |
| |
10/06/14 |
10/27/14 |
21 |
|
|
|
Volvo |
100 |
254 |
|
75.500 |
82.150 |
68.850 |
-6.650 |
-9 |
17,488 |
-80 |
|
| |
10/27/14 |
11/03/14 |
7 |
|
|
|
Getinge |
100 |
107 |
|
162.500 |
171.600 |
153.400 |
-9.100 |
-6 |
16,515 |
-95 |
|
| 11/03/14 |
6/08/15 |
217 |
|
- cash - |
| |
6/08/15 |
7/27/15 |
49 |
|
|
|
Telia Company |
100 |
335 |
|
49.270 |
51.650 |
46.890 |
-2.380 |
-5 |
15,717 |
-31 |
|
| |
7/27/15 |
9/28/15 |
63 |
|
|
|
Tele2 |
100 |
177 |
|
88.500 |
78.150 |
100.221 |
11.721 |
13 |
17,792 |
106 |
|
| |
9/28/15 |
10/05/15 |
7 |
|
|
|
Sandvik |
100 |
261 |
|
67.950 |
76.500 |
59.400 |
-8.550 |
-13 |
15,560 |
-100 |
|
| |
10/05/15 |
10/26/15 |
21 |
|
|
|
Tele2 |
100 |
196 |
|
79.300 |
85.550 |
73.050 |
-6.250 |
-8 |
14,335 |
-76 |
|
| |
10/26/15 |
11/30/15 |
35 |
|
|
|
SKF B |
100 |
93 |
|
152.900 |
152.100 |
153.704 |
0.804 |
1 |
14,410 |
6 |
|
| 11/30/15 |
12/14/15 |
14 |
|
- cash - |
| |
12/14/15 |
12/28/15 |
14 |
|
|
|
SKF B |
100 |
105 |
|
136.500 |
138.100 |
134.900 |
-1.600 |
-1 |
14,242 |
-26 |
|
| 12/28/15 |
1/04/16 |
7 |
|
- cash - |
| |
1/04/16 |
2/08/16 |
35 |
|
|
|
SKF B |
100 |
105 |
|
134.600 |
139.400 |
129.800 |
-4.800 |
-4 |
13,738 |
-32 |
|
| |
2/08/16 |
3/14/16 |
35 |
|
|
|
Tele2 |
100 |
202 |
|
68.000 |
77.150 |
58.850 |
-9.150 |
-13 |
11,890 |
-78 |
|
| |
3/14/16 |
3/21/16 |
7 |
|
|
|
SKF B |
100 |
83 |
|
142.750 |
142.600 |
142.900 |
0.150 |
0 |
11,902 |
6 |
|
| |
3/21/16 |
4/25/16 |
35 |
|
|
|
Nordea Bank |
100 |
145 |
|
81.550 |
79.250 |
83.917 |
2.367 |
3 |
12,246 |
35 |
|
| 4/25/16 |
6/13/16 |
49 |
|
- cash - |
| |
6/13/16 |
7/11/16 |
28 |
|
|
|
Ericsson |
100 |
200 |
|
61.100 |
66.000 |
56.200 |
-4.900 |
-8 |
11,266 |
-66 |
|
| 7/11/16 |
11/07/16 |
119 |
|
- cash - |
| |
11/07/16 |
11/21/16 |
14 |
|
|
|
Ericsson |
100 |
257 |
|
43.720 |
47.630 |
39.810 |
-3.910 |
-9 |
10,261 |
-91 |
|
| 11/21/16 |
11/28/16 |
7 |
|
- cash - |
| |
11/28/16 |
12/05/16 |
7 |
|
|
|
Ericsson |
100 |
215 |
|
47.630 |
49.670 |
45.590 |
-2.040 |
-4 |
9,822 |
-90 |
|
| L/S | date buy | date sell | days | | instrument | spl | pieces | | prc buy | prc sell | ps short | prc diff | d % | asset | yield | |
| 12/05/16 |
7/31/17 |
238 |
|
- cash - |
| |
7/31/17 |
9/04/17 |
35 |
|
|
|
SBB |
100 |
1,640 |
|
5.987 |
6.586 |
5.389 |
-0.599 |
-10 |
8,840 |
-67 |
|
| |
9/04/17 |
10/09/17 |
35 |
|
|
|
Ericsson |
100 |
191 |
|
46.260 |
46.880 |
45.640 |
-0.620 |
-1 |
8,722 |
-13 |
|
| 10/09/17 |
2/05/18 |
119 |
|
- cash - |
| |
2/05/18 |
4/16/18 |
70 |
|
|
|
Sinch |
100 |
1,341 |
|
6.500 |
6.120 |
6.904 |
0.404 |
6 |
9,263 |
37 |
|
| 4/16/18 |
4/23/18 |
7 |
|
- cash - |
| |
4/23/18 |
5/21/18 |
28 |
|
|
|
Getinge |
100 |
96 |
|
95.720 |
86.480 |
105.947 |
10.227 |
11 |
10,245 |
276 |
|
| 5/21/18 |
6/25/18 |
35 |
|
- cash - |
| |
6/25/18 |
7/09/18 |
14 |
|
|
|
Getinge |
100 |
126 |
|
81.220 |
83.860 |
78.580 |
-2.640 |
-3 |
9,912 |
-58 |
|
| 7/09/18 |
10/15/18 |
98 |
|
- cash - |
| |
10/15/18 |
10/22/18 |
7 |
|
|
|
Getinge |
100 |
132 |
|
75.080 |
85.520 |
64.640 |
-10.440 |
-14 |
8,534 |
-100 |
|
| |
10/22/18 |
11/05/18 |
14 |
|
|
|
Electrolux |
100 |
47 |
|
179.050 |
196.650 |
161.450 |
-17.600 |
-10 |
7,707 |
-93 |
|
| |
11/05/18 |
2/04/19 |
91 |
|
|
|
Boliden |
100 |
36 |
|
211.300 |
226.600 |
196.000 |
-15.300 |
-7 |
7,156 |
-26 |
|
| |
2/04/19 |
2/11/19 |
7 |
|
|
|
Kinnevik |
100 |
32 |
|
220.300 |
217.500 |
223.136 |
2.836 |
1 |
7,247 |
95 |
|
| 2/11/19 |
6/03/19 |
112 |
|
- cash - |
| |
6/03/19 |
6/10/19 |
7 |
|
|
|
Swedbank |
100 |
53 |
|
135.100 |
141.950 |
128.250 |
-6.850 |
-5 |
6,884 |
-93 |
|
| 6/10/19 |
7/29/19 |
49 |
|
- cash - |
| |
7/29/19 |
9/02/19 |
35 |
|
|
|
Swedbank |
100 |
51 |
|
133.700 |
122.750 |
145.627 |
11.927 |
9 |
7,492 |
144 |
|
| 9/02/19 |
10/07/19 |
35 |
|
- cash - |
| |
10/07/19 |
10/14/19 |
7 |
|
|
|
Swedbank |
100 |
55 |
|
135.850 |
139.500 |
132.200 |
-3.650 |
-3 |
7,291 |
-76 |
|
| 10/14/19 |
3/02/20 |
140 |
|
- cash - |
| |
3/02/20 |
4/06/20 |
35 |
|
|
|
Kinnevik |
100 |
36 |
|
198.700 |
174.400 |
226.386 |
27.686 |
14 |
8,288 |
290 |
|
| |
4/06/20 |
6/22/20 |
77 |
|
|
|
Electrolux |
100 |
70 |
|
118.000 |
154.750 |
81.250 |
-36.750 |
-31 |
5,715 |
-83 |
|
| 6/22/20 |
10/26/20 |
126 |
|
- cash - |
| |
10/26/20 |
11/09/20 |
14 |
|
|
|
Tele2 |
100 |
52 |
|
108.850 |
108.900 |
108.800 |
-0.050 |
0 |
5,713 |
-1 |
|
| 11/09/20 |
9/27/21 |
322 |
|
- cash - |
| |
9/27/21 |
11/01/21 |
35 |
|
|
|
Kinnevik |
100 |
18 |
|
315.050 |
337.900 |
292.200 |
-22.850 |
-7 |
5,301 |
-54 |
|
| |
11/01/21 |
11/08/21 |
7 |
|
|
|
Ericsson |
100 |
56 |
|
93.260 |
95.360 |
91.160 |
-2.100 |
-2 |
5,184 |
-70 |
|
| |
11/08/21 |
12/27/21 |
49 |
|
|
|
Sinch |
100 |
41 |
|
123.500 |
115.150 |
132.456 |
8.956 |
7 |
5,551 |
68 |
|
| 12/27/21 |
1/24/22 |
28 |
|
- cash - |
| |
1/24/22 |
1/31/22 |
7 |
|
|
|
Sinch |
100 |
63 |
|
87.160 |
94.140 |
80.180 |
-6.980 |
-8 |
5,111 |
-99 |
|
| 1/31/22 |
2/07/22 |
7 |
|
- cash - |
| |
2/07/22 |
8/22/22 |
196 |
|
|
|
Sinch |
100 |
52 |
|
96.480 |
19.834 |
469.315 |
372.835 |
386 |
24,499 |
1,803 |
|
| 8/22/22 |
8/29/22 |
7 |
|
- cash - |
| |
8/29/22 |
10/31/22 |
63 |
|
|
|
Sinch |
100 |
1,270 |
|
19.290 |
25.995 |
12.585 |
-6.705 |
-35 |
15,983 |
-92 |
|
| 10/31/22 |
11/07/22 |
7 |
|
- cash - |
| |
11/07/22 |
11/14/22 |
7 |
|
|
|
SBB |
100 |
957 |
|
16.700 |
18.510 |
14.890 |
-1.810 |
-11 |
14,251 |
-100 |
|
| 11/14/22 |
3/20/23 |
126 |
|
- cash - |
| |
3/20/23 |
3/27/23 |
7 |
|
|
|
SBB |
100 |
1,021 |
|
13.955 |
13.420 |
14.511 |
0.556 |
4 |
14,819 |
668 |
|
| 3/27/23 |
5/01/23 |
35 |
|
- cash - |
| |
5/01/23 |
5/08/23 |
7 |
|
|
|
SBB |
100 |
1,232 |
|
12.024 |
8.410 |
17.191 |
5.167 |
43 |
21,185 |
> 999,999 |
|
| 5/08/23 |
5/22/23 |
14 |
|
- cash - |
| |
5/22/23 |
7/03/23 |
42 |
|
|
|
SBB |
100 |
3,591 |
|
5.899 |
4.137 |
8.412 |
2.513 |
43 |
30,207 |
2,084 |
|
| L/S | date buy | date sell | days | | instrument | spl | pieces | | prc buy | prc sell | ps short | prc diff | d % | asset | yield | |
| 7/03/23 |
7/17/23 |
14 |
|
- cash - |
| |
7/17/23 |
7/24/23 |
7 |
|
|
|
SBB |
100 |
5,656 |
|
5.340 |
4.775 |
5.972 |
0.632 |
12 |
33,781 |
33,991 |
|
| 7/24/23 |
7/31/23 |
7 |
|
- cash - |
| |
7/31/23 |
11/27/23 |
119 |
|
|
|
SBB |
100 |
7,432 |
|
4.545 |
3.851 |
5.364 |
0.819 |
18 |
39,869 |
66 |
|
| 11/27/23 |
5/30/26 |
915 |
|
- cash - |
| accum | 6/05/06 |
11/27/23 | 2478 |
days out of 7453 invested (33%) |
299 |
39,869 |
23 |
|
Instrument Related Contribution
| instrument | L/S | date buy | date sell | days | prc buy | prc sell | ps short | prc diff | d % | | | total |
| Sinch | short | 2/05/18 | 4/16/18 | 70 | 6.50 | 6.12 | 6.90 | 0.40 | 6.21 | | | |
| | | 11/08/21 | 12/27/21 | 49 | 123.50 | 115.15 | 132.46 | 8.96 | 7.25 | | | |
| | | 1/24/22 | 1/31/22 | 7 | 87.16 | 94.14 | 80.18 | -6.98 | -8.01 | | | |
| | | 2/07/22 | 8/22/22 | 196 | 96.48 | 19.83 | 469.31 | 372.83 | 386.44 | | | |
| | | 8/29/22 | 10/31/22 | 63 | 19.29 | 26.00 | 12.59 | -6.71 | -34.76 | | | 232.55 |
| Boliden | | 12/24/07 | 4/28/08 | 126 | 81.25 | 65.75 | 100.40 | 19.15 | 23.57 | | | |
| | | 6/23/08 | 1/05/09 | 196 | 48.60 | 20.60 | 114.66 | 66.06 | 135.92 | | | |
| | | 11/05/18 | 2/04/19 | 91 | 211.30 | 226.60 | 196.00 | -15.30 | -7.24 | | | 170.43 |
| SBB | | 7/31/17 | 9/04/17 | 35 | 5.99 | 6.59 | 5.39 | -0.60 | -10.00 | | | |
| | | 11/07/22 | 11/14/22 | 7 | 16.70 | 18.51 | 14.89 | -1.81 | -10.84 | | | |
| | | 3/20/23 | 3/27/23 | 7 | 13.96 | 13.42 | 14.51 | 0.56 | 3.99 | | | |
| | | 5/01/23 | 5/08/23 | 7 | 12.02 | 8.41 | 17.19 | 5.17 | 42.97 | | | |
| | | 5/22/23 | 7/03/23 | 42 | 5.90 | 4.14 | 8.41 | 2.51 | 42.59 | | | |
| | | 7/17/23 | 7/24/23 | 7 | 5.34 | 4.78 | 5.97 | 0.63 | 11.83 | | | |
| | | 7/31/23 | 11/27/23 | 119 | 4.55 | 3.85 | 5.36 | 0.82 | 18.02 | | | 124.53 |
| Swedbank | | 1/05/09 | 2/02/09 | 28 | 43.80 | 30.20 | 63.52 | 19.72 | 45.03 | | | |
| | | 2/16/09 | 3/02/09 | 14 | 26.80 | 18.40 | 39.03 | 12.23 | 45.65 | | | |
| | | 6/03/19 | 6/10/19 | 7 | 135.10 | 141.95 | 128.25 | -6.85 | -5.07 | | | |
| | | 7/29/19 | 9/02/19 | 35 | 133.70 | 122.75 | 145.63 | 11.93 | 8.92 | | | |
| | | 10/07/19 | 10/14/19 | 7 | 135.85 | 139.50 | 132.20 | -3.65 | -2.69 | | | 112.55 |
| Kinnevik | | 2/04/19 | 2/11/19 | 7 | 220.30 | 217.50 | 223.14 | 2.84 | 1.29 | | | |
| | | 3/02/20 | 4/06/20 | 35 | 198.70 | 174.40 | 226.39 | 27.69 | 13.93 | | | |
| | | 9/27/21 | 11/01/21 | 35 | 315.05 | 337.90 | 292.20 | -22.85 | -7.25 | | | 7.03 |
| Essity B | | 6/04/07 | 6/11/07 | 7 | 95.72 | 93.14 | 98.37 | 2.65 | 2.77 | | | 2.77 |
| Svenska Cellulosa B | | 7/02/07 | 7/09/07 | 7 | 23.25 | 23.81 | 22.69 | -0.56 | -2.41 | | | |
| | | 7/23/07 | 11/19/07 | 119 | 23.86 | 22.28 | 25.55 | 1.69 | 7.09 | | | |
| | | 5/02/11 | 5/09/11 | 7 | 19.21 | 19.59 | 18.83 | -0.38 | -1.98 | | | 2.44 |
| instrument | L/S | date buy | date sell | days | prc buy | prc sell | ps short | prc diff | d % | | | total |
| SKF B | | 10/26/15 | 11/30/15 | 35 | 152.90 | 152.10 | 153.70 | 0.80 | 0.53 | | | |
| | | 12/14/15 | 12/28/15 | 14 | 136.50 | 138.10 | 134.90 | -1.60 | -1.17 | | | |
| | | 1/04/16 | 2/08/16 | 35 | 134.60 | 139.40 | 129.80 | -4.80 | -3.57 | | | |
| | | 3/14/16 | 3/21/16 | 7 | 142.75 | 142.60 | 142.90 | 0.15 | 0.11 | | | -4.09 |
| Volvo | | 9/15/14 | 9/29/14 | 14 | 80.95 | 78.10 | 83.90 | 2.95 | 3.65 | | | |
| | | 10/06/14 | 10/27/14 | 21 | 75.50 | 82.15 | 68.85 | -6.65 | -8.81 | | | -5.48 |
| Nordea Bank | | 5/03/10 | 5/10/10 | 7 | 60.30 | 66.95 | 53.65 | -6.65 | -11.03 | | | |
| | | 3/21/16 | 4/25/16 | 35 | 81.55 | 79.25 | 83.92 | 2.37 | 2.90 | | | -8.45 |
| AstraZeneca | | 2/22/10 | 3/01/10 | 7 | 313.60 | 323.10 | 304.10 | -9.50 | -3.03 | | | |
| | | 3/14/11 | 3/28/11 | 14 | 289.00 | 294.20 | 283.80 | -5.20 | -1.80 | | | |
| | | 4/04/11 | 5/02/11 | 28 | 301.50 | 315.80 | 287.20 | -14.30 | -4.74 | | | -9.29 |
| Tele2 | | 5/16/11 | 5/30/11 | 14 | 124.50 | 123.00 | 126.02 | 1.52 | 1.22 | | | |
| | | 6/06/11 | 6/20/11 | 14 | 118.20 | 119.50 | 116.90 | -1.30 | -1.10 | | | |
| | | 5/28/12 | 7/23/12 | 56 | 109.10 | 112.40 | 105.80 | -3.30 | -3.02 | | | |
| | | 6/10/13 | 7/08/13 | 28 | 80.60 | 80.55 | 80.65 | 0.05 | 0.06 | | | |
| | | 9/02/13 | 9/09/13 | 7 | 84.65 | 83.65 | 85.66 | 1.01 | 1.20 | | | |
| | | 7/27/15 | 9/28/15 | 63 | 88.50 | 78.15 | 100.22 | 11.72 | 13.24 | | | |
| | | 10/05/15 | 10/26/15 | 21 | 79.30 | 85.55 | 73.05 | -6.25 | -7.88 | | | |
| | | 2/08/16 | 3/14/16 | 35 | 68.00 | 77.15 | 58.85 | -9.15 | -13.46 | | | |
| | | 10/26/20 | 11/09/20 | 14 | 108.85 | 108.90 | 108.80 | -0.05 | -0.05 | | | -11.29 |
| Sandvik | | 9/28/15 | 10/05/15 | 7 | 67.95 | 76.50 | 59.40 | -8.55 | -12.58 | | | -12.58 |
| Hexagon | | 10/24/11 | 11/14/11 | 21 | 13.16 | 14.06 | 12.27 | -0.89 | -6.78 | | | |
| | | 11/21/11 | 11/28/11 | 7 | 12.49 | 13.41 | 11.56 | -0.93 | -7.44 | | | -13.71 |
| Telia Company | | 6/20/11 | 6/27/11 | 7 | 44.58 | 46.36 | 42.80 | -1.78 | -3.99 | | | |
| | | 7/11/11 | 7/18/11 | 7 | 44.88 | 48.06 | 41.70 | -3.18 | -7.09 | | | |
| | | 6/08/15 | 7/27/15 | 49 | 49.27 | 51.65 | 46.89 | -2.38 | -4.83 | | | -15.10 |
| instrument | L/S | date buy | date sell | days | prc buy | prc sell | ps short | prc diff | d % | | | total |
| Getinge | | 8/18/14 | 8/25/14 | 7 | 171.30 | 182.10 | 160.50 | -10.80 | -6.30 | | | |
| | | 10/27/14 | 11/03/14 | 7 | 162.50 | 171.60 | 153.40 | -9.10 | -5.60 | | | |
| | | 4/23/18 | 5/21/18 | 28 | 95.72 | 86.48 | 105.95 | 10.23 | 10.68 | | | |
| | | 6/25/18 | 7/09/18 | 14 | 81.22 | 83.86 | 78.58 | -2.64 | -3.25 | | | |
| | | 10/15/18 | 10/22/18 | 7 | 75.08 | 85.52 | 64.64 | -10.44 | -13.91 | | | -18.45 |
| S.E.B | | 3/23/09 | 3/30/09 | 7 | 27.00 | 32.40 | 21.60 | -5.40 | -20.00 | | | -20.00 |
| NIBE Industrier | | 11/19/07 | 12/24/07 | 35 | 3.53 | 4.66 | 2.40 | -1.13 | -32.07 | | | |
| | | 6/02/08 | 6/23/08 | 21 | 2.81 | 2.79 | 2.84 | 0.02 | 0.85 | | | |
| | | 6/21/10 | 7/19/10 | 28 | 4.05 | 3.84 | 4.27 | 0.22 | 5.43 | | | |
| | | 7/26/10 | 8/02/10 | 7 | 4.08 | 4.05 | 4.11 | 0.03 | 0.73 | | | -27.24 |
| Ericsson | | 6/05/06 | 8/28/06 | 84 | 110.00 | 120.00 | 100.00 | -10.00 | -9.09 | | | |
| | | 2/01/10 | 2/15/10 | 14 | 71.95 | 72.80 | 71.10 | -0.85 | -1.18 | | | |
| | | 5/07/12 | 5/28/12 | 21 | 62.65 | 64.70 | 60.60 | -2.05 | -3.27 | | | |
| | | 6/13/16 | 7/11/16 | 28 | 61.10 | 66.00 | 56.20 | -4.90 | -8.02 | | | |
| | | 11/07/16 | 11/21/16 | 14 | 43.72 | 47.63 | 39.81 | -3.91 | -8.94 | | | |
| | | 11/28/16 | 12/05/16 | 7 | 47.63 | 49.67 | 45.59 | -2.04 | -4.28 | | | |
| | | 9/04/17 | 10/09/17 | 35 | 46.26 | 46.88 | 45.64 | -0.62 | -1.34 | | | |
| | | 11/01/21 | 11/08/21 | 7 | 93.26 | 95.36 | 91.16 | -2.10 | -2.25 | | | -32.82 |
| Electrolux | | 8/09/10 | 8/16/10 | 7 | 152.40 | 151.20 | 153.61 | 1.21 | 0.79 | | | |
| | | 7/18/11 | 10/24/11 | 98 | 122.50 | 126.50 | 118.50 | -4.00 | -3.27 | | | |
| | | 11/14/11 | 11/21/11 | 7 | 106.60 | 106.40 | 106.80 | 0.20 | 0.19 | | | |
| | | 3/03/14 | 3/10/14 | 7 | 148.80 | 146.90 | 150.72 | 1.92 | 1.29 | | | |
| | | 10/22/18 | 11/05/18 | 14 | 179.05 | 196.65 | 161.45 | -17.60 | -9.83 | | | |
| | | 4/06/20 | 6/22/20 | 77 | 118.00 | 154.75 | 81.25 | -36.75 | -31.14 | | | -38.56 |
Annotations
| 5/13/22 | Atlas Copco B | | | splits 1:4 (four for one) |
| | Atlas Copco A | | | splits 1:4 (four for one) |
| 5/19/21 | Hexagon | | | stock split 1:7 (seven for one) |
| | Investor | | | stock split 1:4 (four for one) |
| 7/26/18 | OMXS 30 | | | Hexagon replaces Fingerprint Cards |
| 6/29/18 | Autoliv | | | spin-off of Veoneer |
| 6/19/18 | Atlas Copco A | | | spin-off Epiroc |
| 1/02/18 | OMXS 30 | | | Lundin drops out as a consequence of the SCA Essity split |
| 1/02/17 | OMXS 30 | | | Autoliv replaces Nokia |
| 1/04/16 | OMXS 30 | | | Fingerprint Cards replaces MTG |
| 9/10/15 | OMXS 30 | | | complete analysis |
| | OMXS 30 | | | complete analysis |
| 6/03/15 | Assa Abloy | | | ex split 1:3 (three for one) |
| 5/19/15 | Svenska Handelsbank | | | ex Split 1:3 (three for one) |
|
|