Assessment - Austrian Traded Index - 7/01/24 - RS = 30
⇐
⇓ freshest
⇓ 7/01/24
⇓ 12/04/23
prc diff
Δ30
⇓
ATX
3,568.200
8/12/24
0.19
3,648.520
-2.20
3,312.720
335.800
10.14
7.12
Immofinanz
29.550
8/12/24
-0.51
26.400
11.93
19.000
7.400
38.95
20.43
Do&Co
144.600
8/12/24
-2.56
166.600
-13.21
126.600
40.000
31.60
24.32
Bawag
64.400
8/12/24
-1.38
61.000
5.57
48.560
12.440
25.62
20.26
L
Telekom Austria
8.510
8/12/24
2.04
8.990
-5.34
7.370
1.620
21.98
24.74
Erste Group Bank
46.100
8/12/24
0.37
45.090
2.24
37.230
7.860
21.11
17.30
Vienna Insurance
29.800
8/12/24
1.36
30.600
-2.61
25.850
4.750
18.38
7.92
Wienerberger
28.200
8/12/24
-2.76
31.120
-9.38
26.360
4.760
18.06
18.71
Andritz
54.650
8/12/24
-0.55
58.100
-5.94
50.700
7.400
14.60
13.53
L
EVN
29.250
8/12/24
29.700
-1.52
27.200
2.500
9.19
18.01
Raiffeisen Bank Int
16.610
8/12/24
1.59
16.340
1.65
15.410
0.930
6.04
1.72
Uniqa
7.680
8/12/24
0.26
8.000
-4.00
7.600
0.400
5.26
-0.68
OMV
38.980
8/12/24
1.56
40.760
-4.37
39.030
1.730
4.43
-7.22
CA Immobilien
31.940
8/12/24
0.13
31.240
2.24
30.650
0.590
1.92
-4.78
L
Mayr-Melnhof
103.600
8/12/24
1.17
110.800
-6.50
111.600
-0.800
-0.72
-7.39
L
Lenzing
30.350
8/12/24
0.83
33.200
-8.58
34.000
-0.800
-2.35
-0.38
voestalpine
22.080
8/12/24
-0.18
25.280
-12.66
26.440
-1.160
-4.39
-8.15
Österreichische Post
29.550
8/12/24
0.34
30.100
-1.83
31.500
-1.400
-4.44
-5.10
Schoeller-Bleckmann
34.050
8/12/24
-0.87
37.750
-9.80
40.550
-2.800
-6.91
-19.45
L
Verbund
76.850
8/12/24
1.52
75.750
1.45
88.200
-12.450
-14.12
-1.50
AT&S
15.660
8/12/24
2.02
21.580
-27.43
25.340
-3.760
-14.84
-8.21
ATX - 20 out of 20 instruments rated - 7/01/24 / 12/04/23 - 13 did rise, Market-Ratio(30) = 65.00 % Stock Exchange Currency: EUR € Euro
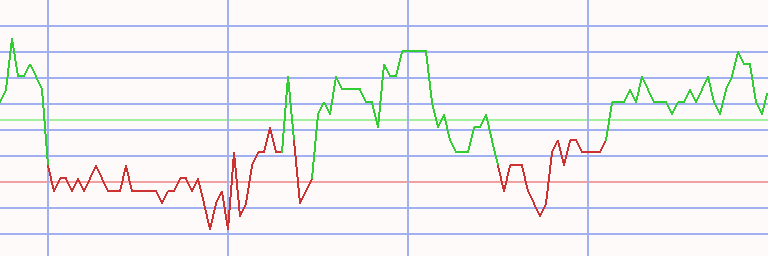
Technical Chart
Transactions Austrian Traded Index * S30 - 29/53 (1)
⇐ L/S date buy date sell days instrument spl pieces prc buy prc sell ps short prc diff d % asset yield
1/02/06 11/26/07 693 - cash -
short
11/26/07
5/25/09
546
Immofinanz
100
187
53.430
10.890
262.146
208.716
391
49,030
190
5/25/09 8/01/11 798 - cash -
8/01/11
3/19/12
231
RHI
100
2,663
18.410
19.750
17.070
-1.340
-7
45,461
-11
3/19/12 8/11/14 875 - cash -
8/11/14
1/26/15
168
Raiffeisen Bank Int
100
2,404
18.910
9.927
36.022
17.112
90
86,598
306
1/26/15 9/14/15 231 - cash -
9/14/15
3/21/16
189
Vienna Insurance
100
3,201
27.050
18.790
38.941
11.891
44
124,662
102
3/21/16 5/23/16 63 - cash -
5/23/16
7/18/16
56
Zumtobel
100
9,905
12.585
13.230
11.940
-0.645
-5
118,273
-29
7/18/16 10/29/18 833 - cash -
10/29/18
7/08/19
252
voestalpine
100
3,873
30.530
26.480
35.199
4.669
15
136,357
23
7/08/19 3/09/20 245 - cash -
3/09/20
10/12/20
217
Schoeller-Bleckmann
100
5,040
27.050
23.800
30.744
3.694
14
154,974
24
10/12/20 3/07/22 511 - cash -
3/07/22
12/05/22
273
Raiffeisen Bank Int
100
14,114
10.980
15.110
6.850
-4.130
-38
96,683
-47
12/05/22 12/19/22 14 - cash -
12/19/22
1/09/23
21
S Immo
100
7,797
12.400
12.420
12.380
-0.020
0
96,527
-3
1/09/23 8/21/23 224 - cash -
8/21/23
12/25/23
126
Lenzing
100
2,317
41.650
36.400
47.657
6.007
14
110,446
48
12/25/23 5/30/26 887 - cash -
accum 11/26/07
12/25/23 2079
days out of 7453 invested (28%)
1,004
110,446
52
Instrument Related Contribution
instrument L/S date buy date sell days prc buy prc sell ps short prc diff d % total Immofinanz short 11/26/07 5/25/09 546 53.43 10.89 262.15 208.72 390.63 390.63 Vienna Insurance 9/14/15 3/21/16 189 27.05 18.79 38.94 11.89 43.96 43.96 Raiffeisen Bank Int 8/11/14 1/26/15 168 18.91 9.93 36.02 17.11 90.49 3/07/22 12/05/22 273 10.98 15.11 6.85 -4.13 -37.61 18.84 voestalpine 10/29/18 7/08/19 252 30.53 26.48 35.20 4.67 15.29 15.29 Lenzing 8/21/23 12/25/23 126 41.65 36.40 47.66 6.01 14.42 14.42 Schoeller-Bleckmann 3/09/20 10/12/20 217 27.05 23.80 30.74 3.69 13.66 13.66 S Immo 12/19/22 1/09/23 21 12.40 12.42 12.38 -0.02 -0.16 -0.16 Zumtobel 5/23/16 7/18/16 56 12.59 13.23 11.94 -0.65 -5.13 -5.13 RHI 8/01/11 3/19/12 231 18.41 19.75 17.07 -1.34 -7.28 -7.28
Annotations
2/19/24 ATX : Component update: Telekom Austria replaces Strabag 9/24/18 ATX Do&Co replaces Porr 6/25/18 Immofinanz reverse stock split 10:1 (one for ten) 5/22/18 ATX component exchange: AT&S and FACC for Agrana and Zumtobel 3/25/17 ATX Machine Learning processed for all techniques. 3/20/17 ATX Flughafen Wien replaces Do&Co 9/19/16 ATX Do&Co replaces AT&S 3/21/16 ATX AT&S replaces Flughafen Wien 9/09/15 ATX complete analysis (scheduled)
write an annotation